Answered step by step
Verified Expert Solution
Question
1 Approved Answer
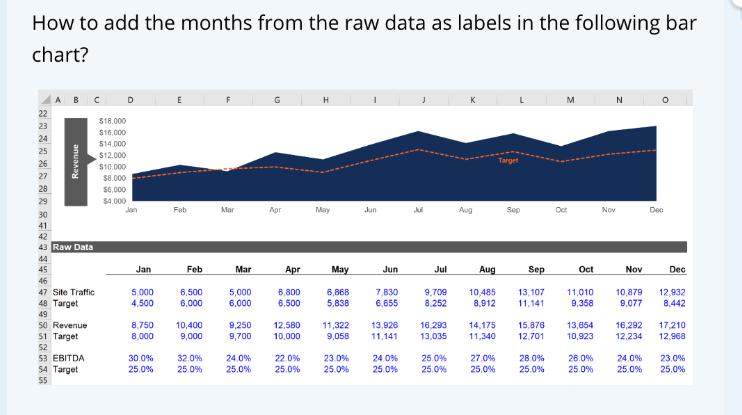
How to add the months from the raw data as labels in the following bar chart? 238889734453955 22 26 30 41 43 Raw Data

How to add the months from the raw data as labels in the following bar chart? 238889734453955 22 26 30 41 43 Raw Data 46 47 Revenue 48 Target 51 50 Revenue Target. 53 Site Traffic 54 EBITDA Target $18.000 $16.000 $14.000 $12.000 $10.000 $8.000 $6,000 $4.000 D Jan Jan 5,000 4.500 8,750 8,000 30.0% 25.0% Fab Feb 6,500 6,000 10,400 9,000 Mar Mar 5,000 6,000 9,250 9,700 G Apr Apr 6,800 6,500 12,580 10,000 H May May 6,868 5,838 11,322 9,058 32.0% 24.0% 22.0% 23.0% 25.0% 25.0% 25.0% Jun Jun 7,830 6,655 13,926 11,141 24.0% 25.0% 25.0% E Jul Aug Aug 9,709 10,485 8.252 8,912 16,293 14,175 13,035 11,340 Target Sep Sep 13,107 11.141 M N Oct 25.0% 27.0% 25.0% 25.0% 25.0% Oct 11,010 9,358 Nov Nov 10,879 9.077 15,876 13,654 16,292 12,701 10,923 12,234 28.0% 26.0% 24.0% 25.0% 25.0% Dec Dec 12,932 8,442 17,210 12,968 23.0% 25.0%
Step by Step Solution
There are 3 Steps involved in it
Step: 1
To add the months from the raw data as labels in the given bar chart you can create a new column or ...
Get Instant Access to Expert-Tailored Solutions
See step-by-step solutions with expert insights and AI powered tools for academic success
Step: 2

Step: 3

Ace Your Homework with AI
Get the answers you need in no time with our AI-driven, step-by-step assistance
Get Started


