Answered step by step
Verified Expert Solution
Question
1 Approved Answer
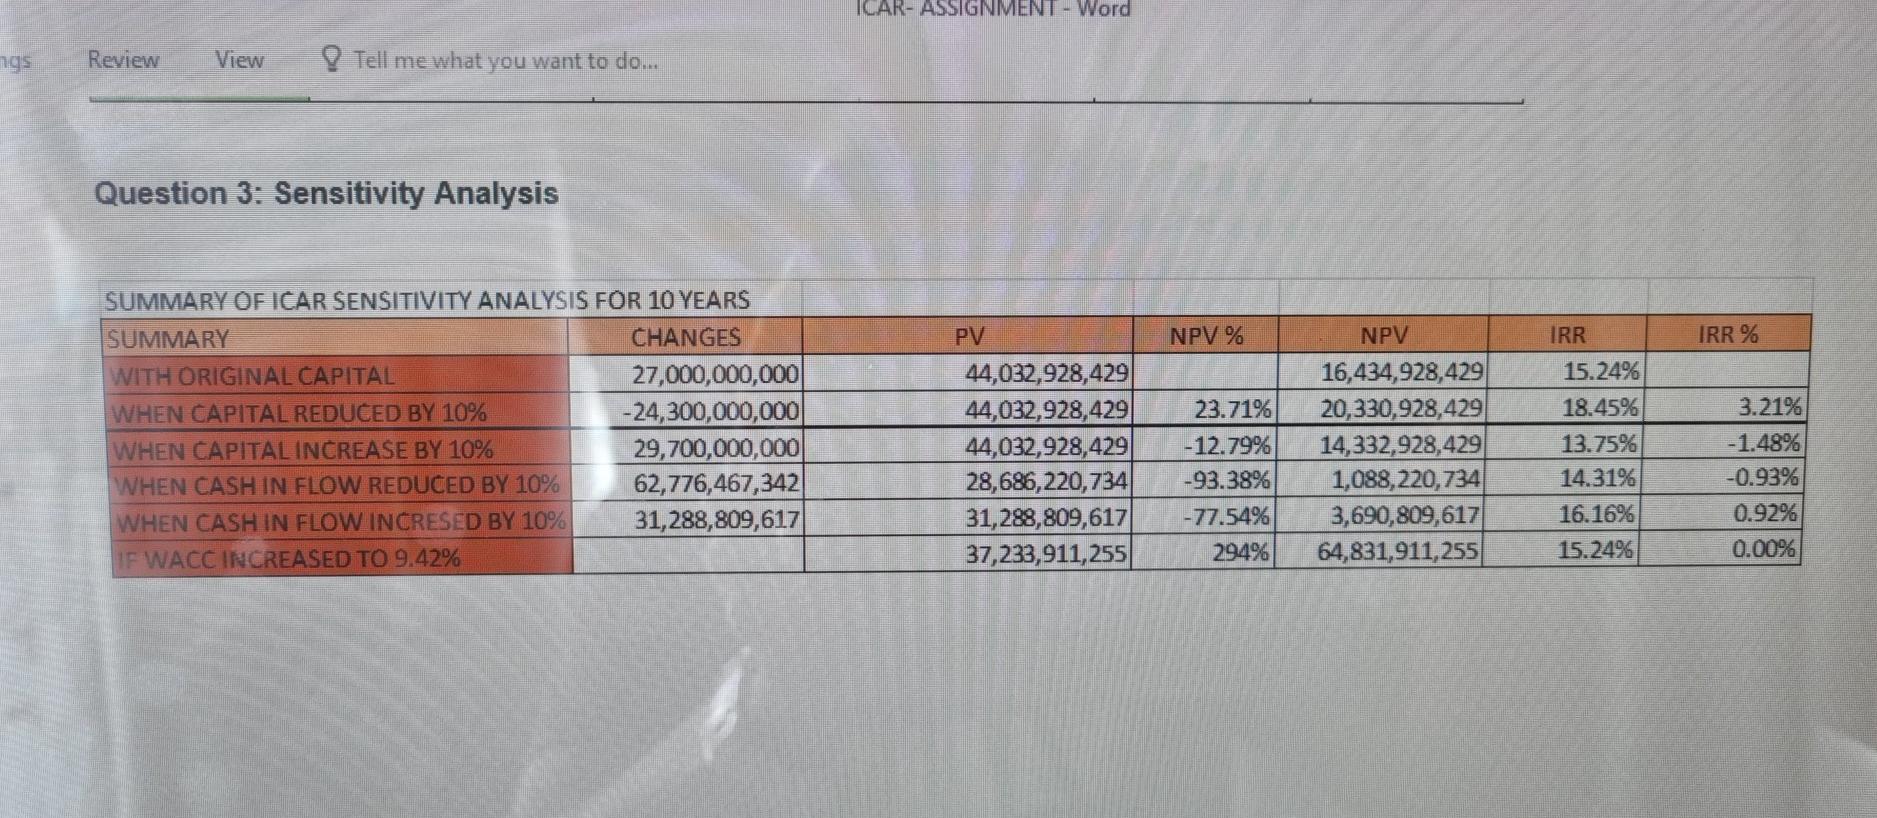
How to analysis this chart? ICAR- ASSIGNMENT - Word ngs Review View Tell me what you want to do... Question 3: Sensitivity Analysis PV NPV

How to analysis this chart?
ICAR- ASSIGNMENT - Word ngs Review View Tell me what you want to do... Question 3: Sensitivity Analysis PV NPV % IRR % SUMMARY OFICAR SENSITIVITY ANALYSIS FOR 10 YEARS SUMMARY CHANGES WITH ORIGINAL CAPITAL 27,000,000,000 WHEN CAPITAL REDUCED BY 10% -24,300,000,000 WHEN CAPITAL INCREASE BY 10% 29,700,000,000 WHEN CASH IN FLOW REDUCED BY 10% 62,776,467,342 WHEN CASH IN FLOW INCRESED BY 10% 31,288,809,617 IF WACC INCREASED TO 9.42% 44,032,928,429 44,032,928,429 44,032,928,429 28,686,220,734 31,288,809,617 37,233,911,255 23.71% -12.79% -93.38% -77.54% 294% NPV 16,434,928,429 20,330,928,429 14,332,928,429 1,088,220,734 3,690,809,617 64,831,911,255 IRR 15.24% 18.45% 13.75% 14.31% 16.16% 15.24% 3.21% -1.48% -0.93% 0.92% 0.00%Step by Step Solution
There are 3 Steps involved in it
Step: 1

Get Instant Access to Expert-Tailored Solutions
See step-by-step solutions with expert insights and AI powered tools for academic success
Step: 2

Step: 3

Ace Your Homework with AI
Get the answers you need in no time with our AI-driven, step-by-step assistance
Get Started


