Question
How to calculate eta square. Look at your ANOVA output table. You need to locate the numbers that intersect with the column SS (sum of
How to calculate eta square. Look at your ANOVA output table. You need to locate the numbers that intersect with the column "SS" (sum of squares) and the three rows listed, Between Groups, Within Groups, and Total. Eta square is calculated with the following division:
- SSbetween/SStotal
As an example: If SS between is 18 and SS total is 140, then my formula is 18/140 = 0.12857
This would mean that 12.86% of the total amount of variance is accounted for by my independent variable.
Guidelines for interpreting how big an effect size is using eta square:
- Less than 0.2 = no effect
- 0.2 - 0.5 = Small to medium effect size
- 0.5 - 0.8 = Medium to large effect size
- Over 0.8 = Large effect size.
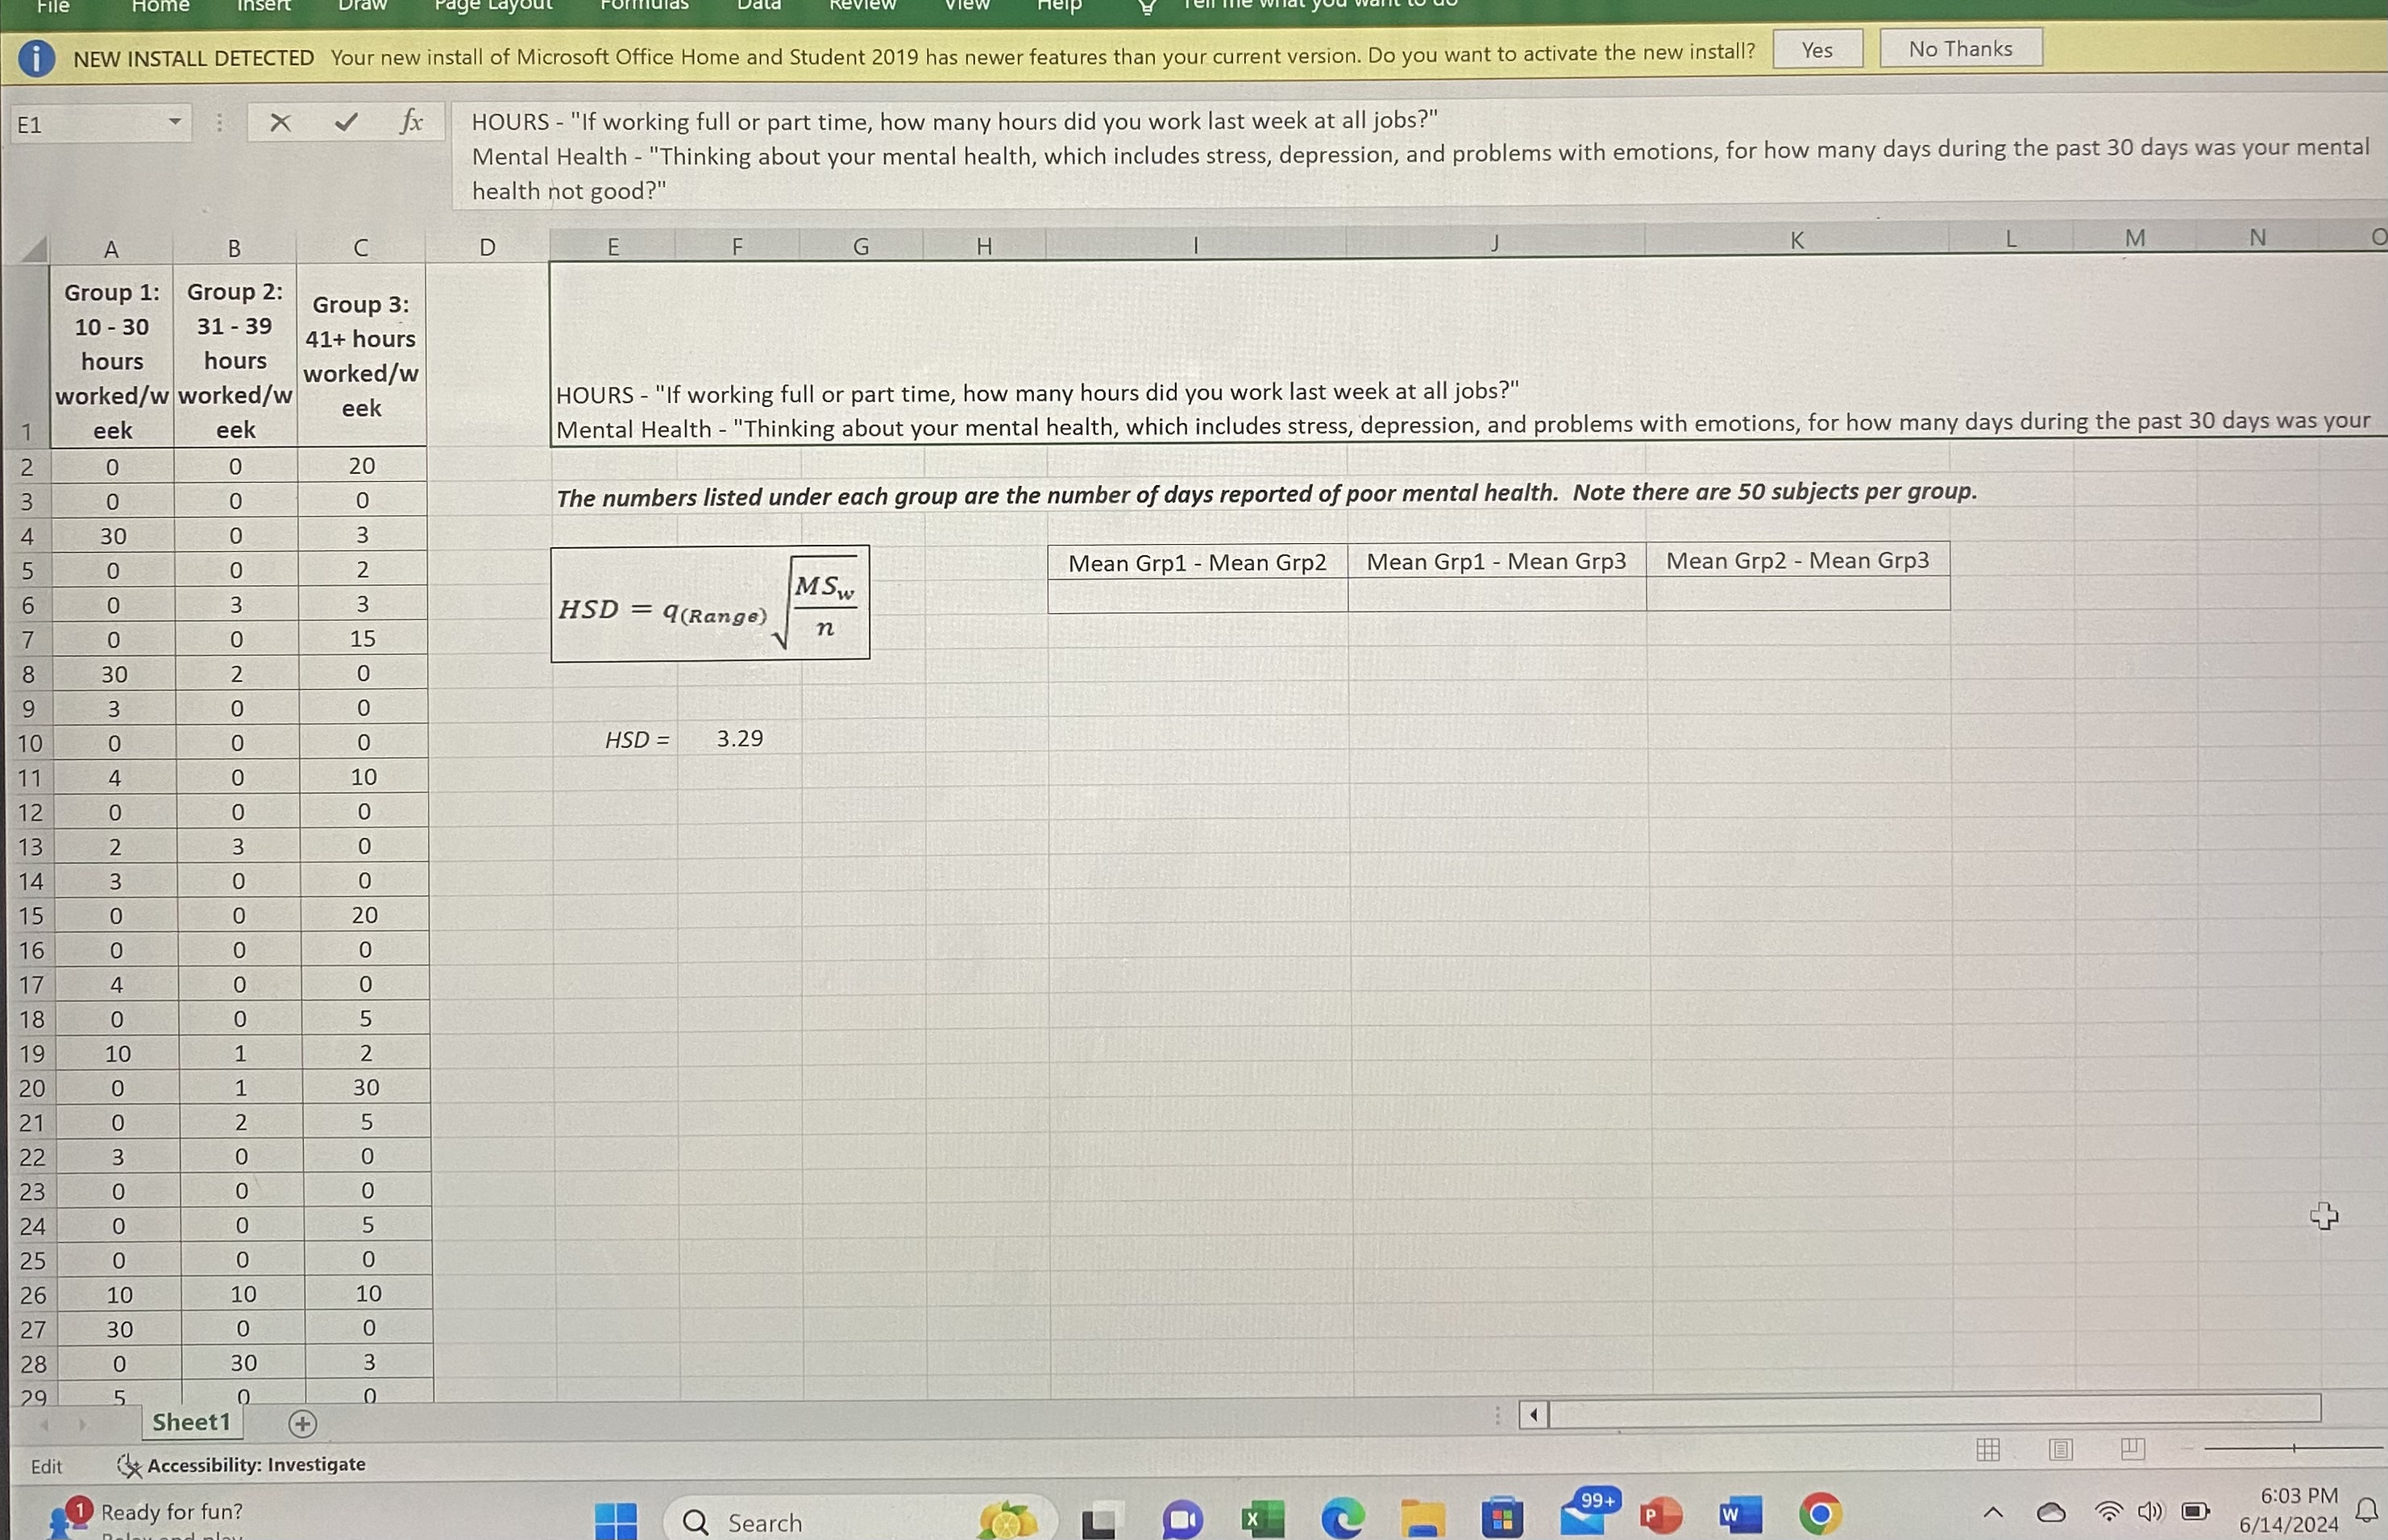
Week 7 Final Project Statistical Analysis - Other Info:
- One of the assignment instructions state to perform a Tukey Range test. This is Tukey's HSD value in which you use the difference between group means to judge whether any particular set of two groups differed from each other. Remember that the HSD value is an absolute number! As an example, +/-2.5 This means that if I have a group comparison that is -2.6, then that IS a significant difference --> there is a significant difference between those two groups because it exceeds Tukey's HSD value.
- You also need to do a bar graph. Bar graph or histogram is fine. Remember that when graphing, the independent variable (which is also referred to as the X variable) goes along the bottom; the horizontal axis. It essentially labels the columns. The dependent variable (which is also referred to as the Y variable) goes on the vertical axis.

Step by Step Solution
There are 3 Steps involved in it
Step: 1

Get Instant Access to Expert-Tailored Solutions
See step-by-step solutions with expert insights and AI powered tools for academic success
Step: 2

Step: 3

Ace Your Homework with AI
Get the answers you need in no time with our AI-driven, step-by-step assistance
Get Started


