Answered step by step
Verified Expert Solution
Question
1 Approved Answer
How to calculate the free cash flow for the firm? ASX Code BHP BHP BHP BHP BHP BHP BHP BHP BHP BHP BHP BHP BHP
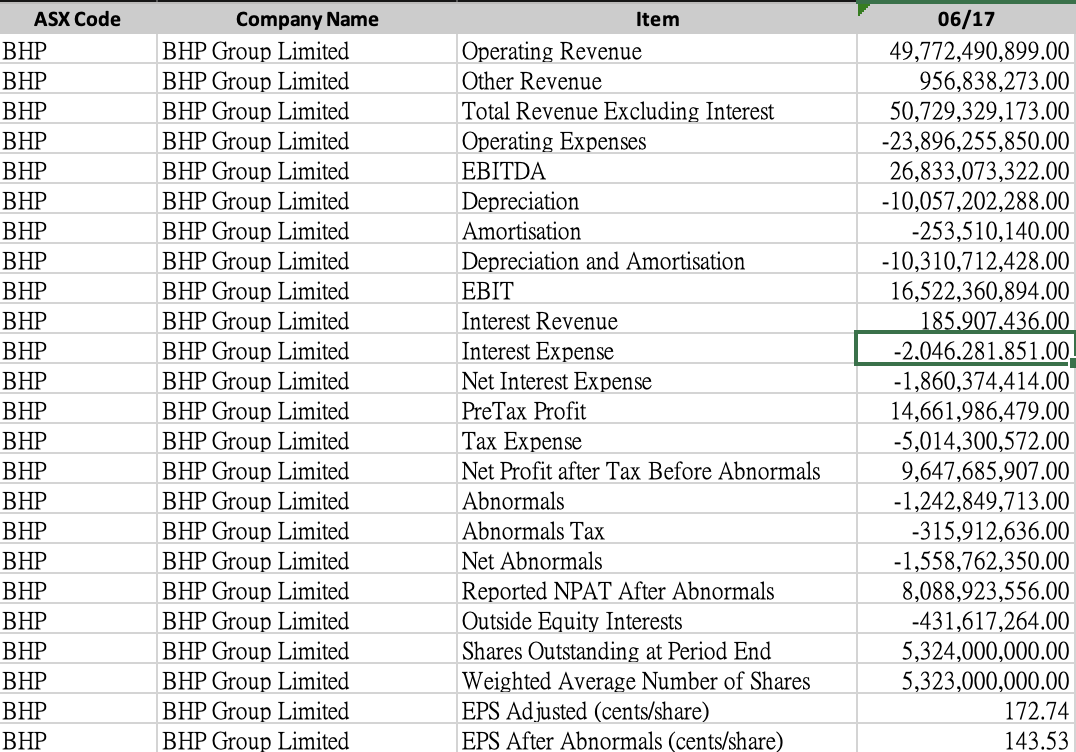
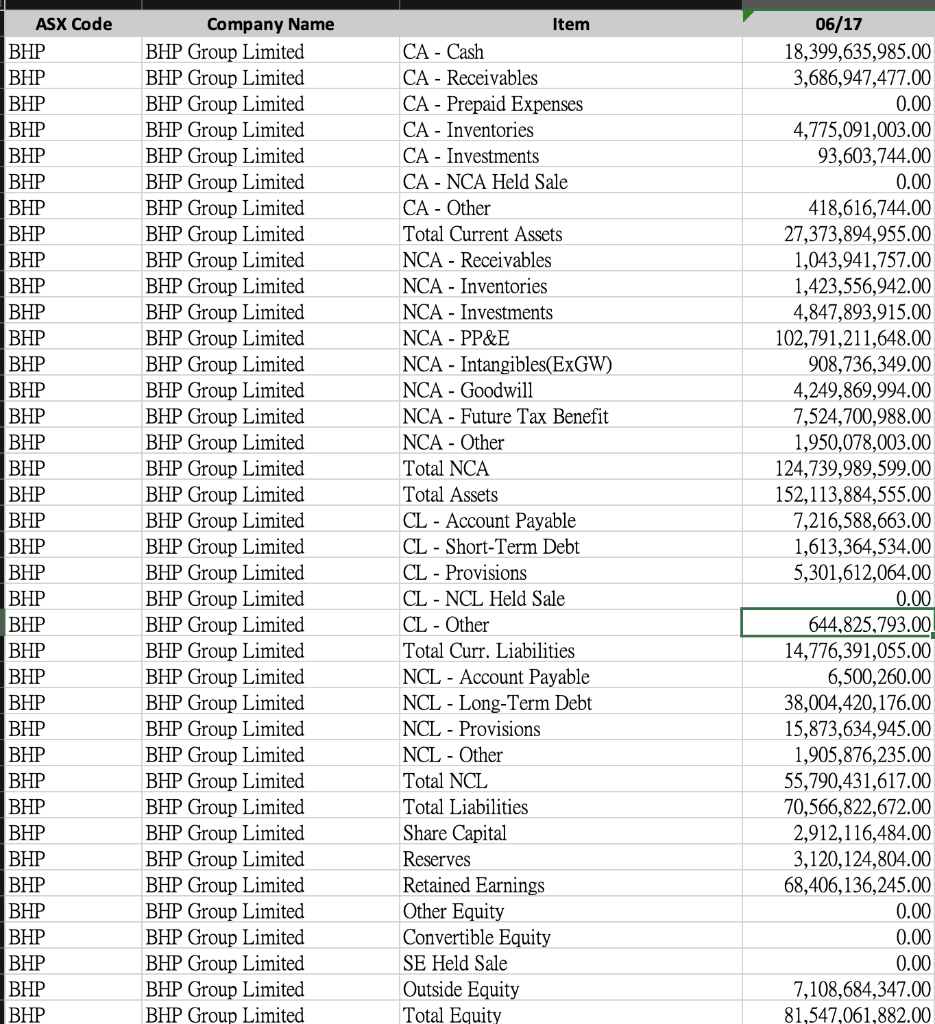
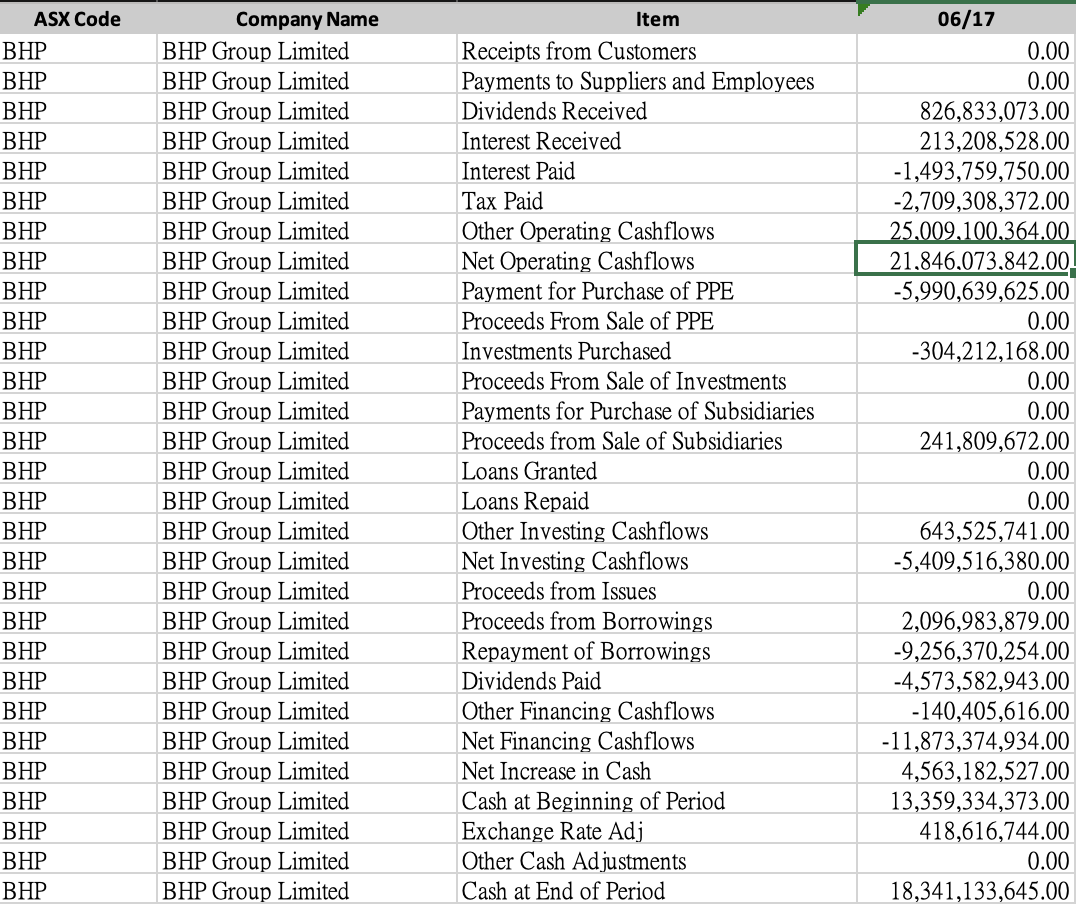
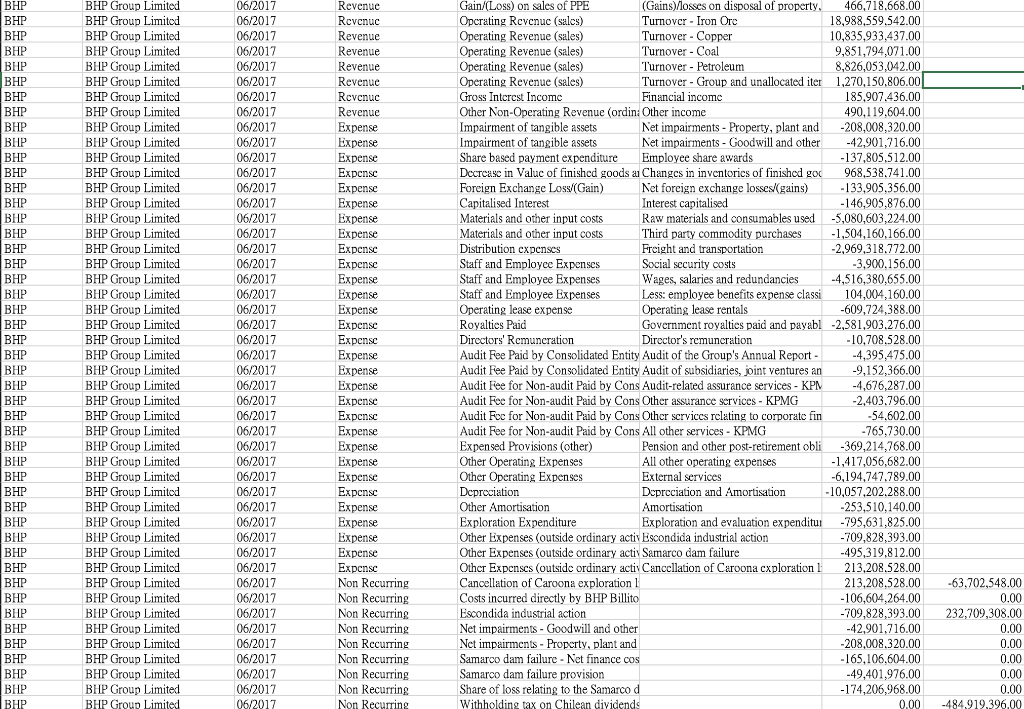
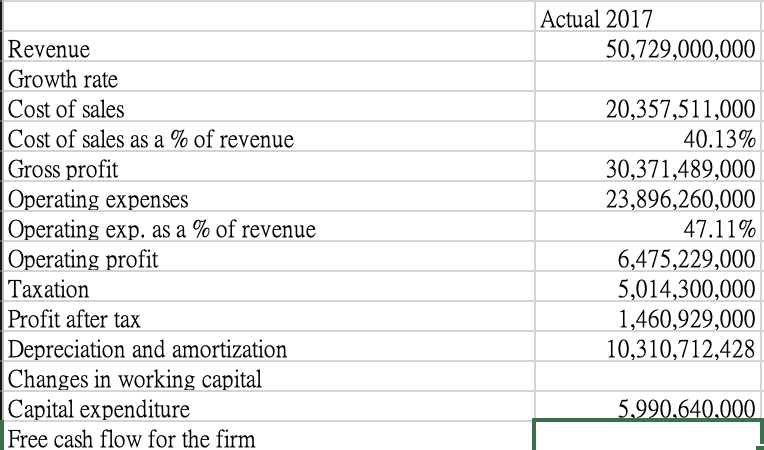
How to calculate the free cash flow for the firm?
ASX Code BHP BHP BHP BHP BHP BHP BHP BHP BHP BHP BHP BHP BHP BHP BHP BHP BHP BHP BHP BHP BHP BHP BHP BHP Company Name BHP Group Limited BHP Group Limited BHP Group Limited BHP Group Limited BHP Group Limited BHP Group Limited BHP Group Limited BHP Group Limited BHP Group Limited BHP Group Limited BHP Group Limited BHP Group Limited BHP Group Limited BHP Group Limited BHP Group Limited BHP Group Limited BHP Group Limited BHP Group Limited BHP Group Limited BHP Group Limited BHP Group Limited BHP Group Limited BHP Group Limited BHP Group Limited Item Operating Revenue Other Revenue Total Revenue Excluding Interest Operating Expenses EBITDA Depreciation Amortisation Depreciation and Amortisation EBIT Interest Revenue Interest Expense Net Interest Expense PreTax Profit Tax Expense Net Profit after Tax Before Abnormals Abnormals Abnormals Tax Net Abnormals Reported NPAT After Abnormals Outside Equity Interests Shares Outstanding at Period End Weighted Average Number of Shares EPS Adjusted (cents/share) EPS After Abnormals (cents/share) 06/17 49,772,490,899.00 956,838,273.00 50,729,329,173.00 -23,896,255,850.00 26,833,073,322.00 -10,057,202,288.00 -253,510,140.00 -10,310,712,428.00 16,522,360,894.00 185,907,436.00 -2,046,281,851.00. -1,860,374,414.00 14,661,986,479.00 -5,014,300,572.00 9,647,685,907.00 -1,242,849,713.00 -315,912,636.00 -1,558,762,350.00 8,088,923,556.00 -431,617,264.00 5,324,000,000.00 5,323,000,000.00 172.74 143.53 ASX Code BHP BHP BHP BHP BHP BHP BHP BHP BHP BHP BHP BHP BHP BHP BHP BHP BHP BHP BHP BHP BHP BHP BHP BHP BHP BHP BHP BHP BHP BHP BHP BHP BHP BHP Company Name BHP Group Limited BHP Group Limited BHP Group Limited BHP Group Limited BHP Group Limited BHP Group Limited BHP Group Limited BHP Group Limited BHP Group Limited BHP Group Limited BHP Group Limited BHP Group Limited BHP Group Limited BHP Group Limited BHP Group Limited BHP Group Limited BHP Group Limited BHP Group Limited BHP Group Limited BHP Group Limited BHP Group Limited BHP Group Limited BHP Group Limited BHP Group Limited BHP Group Limited BHP Group Limited BHP Group Limited BHP Group Limited BHP Group Limited BHP Group Limited BHP Group Limited BHP Group Limited BHP Group Limited BHP Group Limited BHP Group Limited BHP Group Limited BHP Group Limited BHP Group Limited Item CA - Cash CA - Receivables CA - Prepaid Expenses CA - Inventories CA - Investments CA - NCA Held Sale CA - Other Total Current Assets NCA - Receivables NCA - Inventories NCA - Investments NCA - PP&E NCA - Intangibles(ExGW) NCA - Goodwill NCA - Future Tax Benefit NCA - Other Total NCA Total Assets CL - Account Payable CL - Short-Term Debt CL - Provisions CL - NCL Held Sale CL - Other Total Curr. Liabilities NCL - Account Payable NCL - Long-Term Debt NCL - Provisions NCL - Other Total NCL Total Liabilities Share Capital Reserves Retained Earnings Other Equity Convertible Equity SE Held Sale Outside Equity Total Equity 06/17 18,399,635,985.00 3,686,947,477.00 0.00 4,775,091,003.00 93,603,744.00 0.00 418,616,744.00 27,373,894,955.00 1,043,941,757.00 1,423,556,942.00 4,847,893,915.00 102,791,211,648.00 908,736,349.00 4,249,869,994.00 7,524,700,988.00 1,950,078,003.00 124,739,989,599.00 152,113,884,555.00 7,216,588,663.00 1,613,364,534.00 5,301,612,064.00 0.00 644,825,793.00 14,776,391,055.00 6,500,260.00 38,004,420,176.00 15,873,634,945.00 1,905,876,235.00 55,790,431,617.00 70,566,822,672.00 2,912,116,484.00 3,120,124,804.00 68,406, 136,245.00 0.00 0.00 0.00 7,108,684,347.00 81,547,061,882.00 BHP BHP BHP BHP ASX Code BHP BHP BHP BHP BHP BHP BHP BHP BHP BHP BHP BHP BHP BHP BHP BHP BHP BHP BHP BHP BHP BHP BHP BHP BHP BHP BHP BHP BHP Company Name BHP Group Limited BHP Group Limited BHP Group Limited BHP Group Limited BHP Group Limited BHP Group Limited BHP Group Limited BHP Group Limited BHP Group Limited BHP Group Limited BHP Group Limited BHP Group Limited BHP Group Limited BHP Group Limited BHP Group Limited BHP Group Limited BHP Group Limited BHP Group Limited BHP Group Limited BHP Group Limited BHP Group Limited BHP Group Limited BHP Group Limited BHP Group Limited BHP Group Limited BHP Group Limited BHP Group Limited BHP Group Limited BHP Group Limited Item Receipts from Customers Payments to Suppliers and Employees Dividends Received Interest Received Interest Paid Tax Paid Other Operating Cashflows Net Operating Cashflows Payment for Purchase of PPE Proceeds From Sale of PPE Investments Purchased Proceeds From Sale of Investments Payments for Purchase of Subsidiaries Proceeds from Sale of Subsidiaries Loans Granted Loans Repaid Other Investing Cashflows Net Investing Cashflows Proceeds from Issues Proceeds from Borrowings Repayment of Borrowings Dividends Paid Other Financing Cashflows Net Financing Cashflows Net Increase in Cash Cash at Beginning of Period Exchange Rate Adj Other Cash Adjustments Cash at End of Period 06/17 0.00 0.00 826,833,073.00 213,208,528.00 -1,493,759,750.00 -2,709,308,372.00 25.009.100.364.00 21.846,073,842.00 -5,990,639,625.00 0.00 -304,212,168.00 0.00 0.00 241,809,672.00 0.00 0.00 643,525,741.00 -5,409,516,380.00 0.00 2,096,983,879.00 -9,256,370,254.00 -4,573,582,943.00 -140,405,616.00 -11,873,374,934.00 4,563,182,527.00 13,359,334,373.00 418,616,744.00 0.00 18,341,133,645.00 06/2017 06/2017 06/2017 06/2017 06/2017 06/2017 06/2017 06/2017 06/2017 06/2017 06/2017 06/2017 06/2017 06/2017 06/2017 06/2017 06/2017 06/2017 BHP BHP BHP BHP BHP BHP BHP BHP BHP BHP BHP BHP BHP | BHP BHP BHP BHP BHP BHP BHP BHP BHP BHP BHP BHP BHP BHP BHP BHP BHP BHP BHP BHP BHP BHP BHP BHP BHP | BHP BHP BHP BHP BHP BHP BHP BHP Group Limited BHP Group Limited BHP Group Limited BHP Group Limited BHP Group Limited BHP Group Limited BHP Group Limited BHP Group Limited BHP Group Limited BHP Group Limited BHP Group Limited BHP Group Limited BHP Group Limited BHP Group Limited BHP Group Limited BHP Group Limited BHP Group Limited BHP Group Limited BHP Group Limited BHP Group Limited BHP Group Limited BHP Group Limited BHP Group Limited BHP Group Limited BHP Group Limited BHP Group Limited BHP Group Limited BHP Group Limited BHP Group Limited BHP Group Limited BHP Limited BHP Group Limited BHP Group Limited BHP Group Limited BHP Group Limited BHP Group Limited BHP Group Limited BHP Group Limited BHP Group Limited BHP Group Limited BHP Group Limited BHP Group Limited BHP Group Limited BHP Group Limited BHP Group Limited BHP Group Limited BHP Group Limited 06/2017 06/2017 06/2017 06/2017 06/2017 06/2017 Revenue Revenue Revenue Revenue Revenue Revenue Revenue Revenue Expense Expense Expense Expense Expense Expense Expense Expense Expense Expense Expense Expense Expense Expense Expense Expense Expense Expense Expense Expense Expense Expense pense Expense Expense Expense Expense Expense Expense Expense Non Recurring Non Recurring Non Recurring Non Recurring Non Recurring Non Recurring Non Recurring Non Recurring Non Recurring Gain/(Loss) on sales of PPE (Gains)/losses on disposal of property, 466,718.668.00 Operating Rcvcnuc (sales) Turnover - Iron Orc 18,988,559.542.00 Operating Revenue (sales) Turnover - Copper 10,835,933,437.00 Operating Revenue (sales) Turnover - Coal 9,851,794,071.00 Operating Revenue (sales) Turnover - Petroleum 8,826,053,042.00 Operating Revenue (sales) Turnover - Group and unallocated iter 1,270,150.806.00 Gross Interest Income Financial income 185,907,436.00 Other Non-Operating Revenue (ordin: Other income 490,119,604.00 Impairment of tangible assets Net impairments - Property, plant and -208,008,320.00 Impairment of f tangible assets Net impairments - Goodwill and other -42,901,716.00 Share based payment expenditure Employee share awards - 137,805,512.00 Decrease in Value of finished goods as Changes in inventorics of finished god 968,538.741.00 Foreign Exchange Loss/(Gain) Net foreign exchange losses/gains) -133,905,356.00 Capitalised Interest Interest capitalised -146,905,876.00 Materials and other input costs Raw materials and consumables used 5.080.603,224.00 Materials and other input costs Third party commodity purchases -1,504,160,166.00 Distribution expenses Freight and transportation -2,969,318.772.00 Staff and Employee Expenses Social security costs -3,900,156.00 Staff and Employee Expenses Wages, salaries and redundancies -4,516,380,655.00 Staff and Employee Expenses Less: employee benefits expense classi 104,004,160.00 Operating lease expense Operating lease rentals -609,724,388.00 Royalties Paid Government royalties paid and payabl -2,581,903.276.00 Directors' Remuncration Director's remuncration -10,708.528.00 Audit Fee Paid by Consolidated Entity Audit of the Group's Annual Report - -4,395,475.00 Audit Fee Paid by Consolidated Entity Audit of subsidiaries, joint ventures an -9,152,366.00 Audit Fee for Non-audit Paid by Cons Audit-related assurance services - KPM -4,676,287.00 Audit Foe for Non-audit Paid by Cons Other assurance services - KPMG -2,403.796.00 Audit Foc for Non-audit Paid by Cons Other scrvices relating to corporate fin -54.602.00 Audit Fee for Non-audit Paid by Cons All other services - KPMG -765,730.00 Expensed Provisions (other) Pension and other post-retirement obli -369,214,768.00 Other Operating Expenses All other ope ting expenses -1,417,056,682.00 Other Operating Expenses External services -6,194,747.789.00 Depreciation Depreciation and Amortisation -10,057,202.288.00 Other Amortisation Amortisation -253,510,140.00 Exploration Expenditure Exploration and evaluation expenditur -795,631,825.00 Other Expenses (outside ordinary activ Escondida industrial action -709,828,393.00 Other Expenses (outside ordinary activ Samarco dam failure -495,319,812.00 Other Expenscs (outside ordinary activ Cancellation Caroona exploration 1 213,208.528.00 Cancellation of Caroona exploration 1 213,208.528.00 Costs incurred directly by BHP Billito -106,604,264.00 Escondida industrial action -709,828,393.00 Net impairments - Goodwill and other -42,901,716.00 Net impairments - Property, plant and -208,008.320.00 Samarco dam failure - Net finance cos -165, 106,604.00 Samarco dam failure provision -49,401,976.00 Share of loss relating to the Samarco d -174,206,968.00 Withholding tax on Chilean dividends 0.00 06/2017 06/2017 06/2017 06/2017 06/2017 06/2017 06/2017 06/2017 06/2017 06/2017 06/2017 06/2017 06/2017 06/2017 06/2017 06/2017 06/2017 06/2017 06/2017 06/2017 06/2017 06/2017 06/2017 -63,702,548.00 0.00 232,709,308.00 0.00 0.00 0.00 0.00 0.00 -484 919,396.00 Actual 2017 50,729,000,000 Revenue Growth rate Cost of sales Cost of sales as a % of revenue Gross profit Operating expenses Operating exp. as a % of revenue Operating profit Taxation Profit after tax Depreciation and amortization Changes in working capital Capital expenditure Free cash flow for the firm 20,357,511,000 40.13% 30,371,489,000 23,896,260,000 47.11% 6,475,229,000 5,014,300,000 1,460,929,000 10,310,712,428 5.990,640.000 ASX Code BHP BHP BHP BHP BHP BHP BHP BHP BHP BHP BHP BHP BHP BHP BHP BHP BHP BHP BHP BHP BHP BHP BHP BHP Company Name BHP Group Limited BHP Group Limited BHP Group Limited BHP Group Limited BHP Group Limited BHP Group Limited BHP Group Limited BHP Group Limited BHP Group Limited BHP Group Limited BHP Group Limited BHP Group Limited BHP Group Limited BHP Group Limited BHP Group Limited BHP Group Limited BHP Group Limited BHP Group Limited BHP Group Limited BHP Group Limited BHP Group Limited BHP Group Limited BHP Group Limited BHP Group Limited Item Operating Revenue Other Revenue Total Revenue Excluding Interest Operating Expenses EBITDA Depreciation Amortisation Depreciation and Amortisation EBIT Interest Revenue Interest Expense Net Interest Expense PreTax Profit Tax Expense Net Profit after Tax Before Abnormals Abnormals Abnormals Tax Net Abnormals Reported NPAT After Abnormals Outside Equity Interests Shares Outstanding at Period End Weighted Average Number of Shares EPS Adjusted (cents/share) EPS After Abnormals (cents/share) 06/17 49,772,490,899.00 956,838,273.00 50,729,329,173.00 -23,896,255,850.00 26,833,073,322.00 -10,057,202,288.00 -253,510,140.00 -10,310,712,428.00 16,522,360,894.00 185,907,436.00 -2,046,281,851.00. -1,860,374,414.00 14,661,986,479.00 -5,014,300,572.00 9,647,685,907.00 -1,242,849,713.00 -315,912,636.00 -1,558,762,350.00 8,088,923,556.00 -431,617,264.00 5,324,000,000.00 5,323,000,000.00 172.74 143.53 ASX Code BHP BHP BHP BHP BHP BHP BHP BHP BHP BHP BHP BHP BHP BHP BHP BHP BHP BHP BHP BHP BHP BHP BHP BHP BHP BHP BHP BHP BHP BHP BHP BHP BHP BHP Company Name BHP Group Limited BHP Group Limited BHP Group Limited BHP Group Limited BHP Group Limited BHP Group Limited BHP Group Limited BHP Group Limited BHP Group Limited BHP Group Limited BHP Group Limited BHP Group Limited BHP Group Limited BHP Group Limited BHP Group Limited BHP Group Limited BHP Group Limited BHP Group Limited BHP Group Limited BHP Group Limited BHP Group Limited BHP Group Limited BHP Group Limited BHP Group Limited BHP Group Limited BHP Group Limited BHP Group Limited BHP Group Limited BHP Group Limited BHP Group Limited BHP Group Limited BHP Group Limited BHP Group Limited BHP Group Limited BHP Group Limited BHP Group Limited BHP Group Limited BHP Group Limited Item CA - Cash CA - Receivables CA - Prepaid Expenses CA - Inventories CA - Investments CA - NCA Held Sale CA - Other Total Current Assets NCA - Receivables NCA - Inventories NCA - Investments NCA - PP&E NCA - Intangibles(ExGW) NCA - Goodwill NCA - Future Tax Benefit NCA - Other Total NCA Total Assets CL - Account Payable CL - Short-Term Debt CL - Provisions CL - NCL Held Sale CL - Other Total Curr. Liabilities NCL - Account Payable NCL - Long-Term Debt NCL - Provisions NCL - Other Total NCL Total Liabilities Share Capital Reserves Retained Earnings Other Equity Convertible Equity SE Held Sale Outside Equity Total Equity 06/17 18,399,635,985.00 3,686,947,477.00 0.00 4,775,091,003.00 93,603,744.00 0.00 418,616,744.00 27,373,894,955.00 1,043,941,757.00 1,423,556,942.00 4,847,893,915.00 102,791,211,648.00 908,736,349.00 4,249,869,994.00 7,524,700,988.00 1,950,078,003.00 124,739,989,599.00 152,113,884,555.00 7,216,588,663.00 1,613,364,534.00 5,301,612,064.00 0.00 644,825,793.00 14,776,391,055.00 6,500,260.00 38,004,420,176.00 15,873,634,945.00 1,905,876,235.00 55,790,431,617.00 70,566,822,672.00 2,912,116,484.00 3,120,124,804.00 68,406, 136,245.00 0.00 0.00 0.00 7,108,684,347.00 81,547,061,882.00 BHP BHP BHP BHP ASX Code BHP BHP BHP BHP BHP BHP BHP BHP BHP BHP BHP BHP BHP BHP BHP BHP BHP BHP BHP BHP BHP BHP BHP BHP BHP BHP BHP BHP BHP Company Name BHP Group Limited BHP Group Limited BHP Group Limited BHP Group Limited BHP Group Limited BHP Group Limited BHP Group Limited BHP Group Limited BHP Group Limited BHP Group Limited BHP Group Limited BHP Group Limited BHP Group Limited BHP Group Limited BHP Group Limited BHP Group Limited BHP Group Limited BHP Group Limited BHP Group Limited BHP Group Limited BHP Group Limited BHP Group Limited BHP Group Limited BHP Group Limited BHP Group Limited BHP Group Limited BHP Group Limited BHP Group Limited BHP Group Limited Item Receipts from Customers Payments to Suppliers and Employees Dividends Received Interest Received Interest Paid Tax Paid Other Operating Cashflows Net Operating Cashflows Payment for Purchase of PPE Proceeds From Sale of PPE Investments Purchased Proceeds From Sale of Investments Payments for Purchase of Subsidiaries Proceeds from Sale of Subsidiaries Loans Granted Loans Repaid Other Investing Cashflows Net Investing Cashflows Proceeds from Issues Proceeds from Borrowings Repayment of Borrowings Dividends Paid Other Financing Cashflows Net Financing Cashflows Net Increase in Cash Cash at Beginning of Period Exchange Rate Adj Other Cash Adjustments Cash at End of Period 06/17 0.00 0.00 826,833,073.00 213,208,528.00 -1,493,759,750.00 -2,709,308,372.00 25.009.100.364.00 21.846,073,842.00 -5,990,639,625.00 0.00 -304,212,168.00 0.00 0.00 241,809,672.00 0.00 0.00 643,525,741.00 -5,409,516,380.00 0.00 2,096,983,879.00 -9,256,370,254.00 -4,573,582,943.00 -140,405,616.00 -11,873,374,934.00 4,563,182,527.00 13,359,334,373.00 418,616,744.00 0.00 18,341,133,645.00 06/2017 06/2017 06/2017 06/2017 06/2017 06/2017 06/2017 06/2017 06/2017 06/2017 06/2017 06/2017 06/2017 06/2017 06/2017 06/2017 06/2017 06/2017 BHP BHP BHP BHP BHP BHP BHP BHP BHP BHP BHP BHP BHP | BHP BHP BHP BHP BHP BHP BHP BHP BHP BHP BHP BHP BHP BHP BHP BHP BHP BHP BHP BHP BHP BHP BHP BHP BHP | BHP BHP BHP BHP BHP BHP BHP BHP Group Limited BHP Group Limited BHP Group Limited BHP Group Limited BHP Group Limited BHP Group Limited BHP Group Limited BHP Group Limited BHP Group Limited BHP Group Limited BHP Group Limited BHP Group Limited BHP Group Limited BHP Group Limited BHP Group Limited BHP Group Limited BHP Group Limited BHP Group Limited BHP Group Limited BHP Group Limited BHP Group Limited BHP Group Limited BHP Group Limited BHP Group Limited BHP Group Limited BHP Group Limited BHP Group Limited BHP Group Limited BHP Group Limited BHP Group Limited BHP Limited BHP Group Limited BHP Group Limited BHP Group Limited BHP Group Limited BHP Group Limited BHP Group Limited BHP Group Limited BHP Group Limited BHP Group Limited BHP Group Limited BHP Group Limited BHP Group Limited BHP Group Limited BHP Group Limited BHP Group Limited BHP Group Limited 06/2017 06/2017 06/2017 06/2017 06/2017 06/2017 Revenue Revenue Revenue Revenue Revenue Revenue Revenue Revenue Expense Expense Expense Expense Expense Expense Expense Expense Expense Expense Expense Expense Expense Expense Expense Expense Expense Expense Expense Expense Expense Expense pense Expense Expense Expense Expense Expense Expense Expense Non Recurring Non Recurring Non Recurring Non Recurring Non Recurring Non Recurring Non Recurring Non Recurring Non Recurring Gain/(Loss) on sales of PPE (Gains)/losses on disposal of property, 466,718.668.00 Operating Rcvcnuc (sales) Turnover - Iron Orc 18,988,559.542.00 Operating Revenue (sales) Turnover - Copper 10,835,933,437.00 Operating Revenue (sales) Turnover - Coal 9,851,794,071.00 Operating Revenue (sales) Turnover - Petroleum 8,826,053,042.00 Operating Revenue (sales) Turnover - Group and unallocated iter 1,270,150.806.00 Gross Interest Income Financial income 185,907,436.00 Other Non-Operating Revenue (ordin: Other income 490,119,604.00 Impairment of tangible assets Net impairments - Property, plant and -208,008,320.00 Impairment of f tangible assets Net impairments - Goodwill and other -42,901,716.00 Share based payment expenditure Employee share awards - 137,805,512.00 Decrease in Value of finished goods as Changes in inventorics of finished god 968,538.741.00 Foreign Exchange Loss/(Gain) Net foreign exchange losses/gains) -133,905,356.00 Capitalised Interest Interest capitalised -146,905,876.00 Materials and other input costs Raw materials and consumables used 5.080.603,224.00 Materials and other input costs Third party commodity purchases -1,504,160,166.00 Distribution expenses Freight and transportation -2,969,318.772.00 Staff and Employee Expenses Social security costs -3,900,156.00 Staff and Employee Expenses Wages, salaries and redundancies -4,516,380,655.00 Staff and Employee Expenses Less: employee benefits expense classi 104,004,160.00 Operating lease expense Operating lease rentals -609,724,388.00 Royalties Paid Government royalties paid and payabl -2,581,903.276.00 Directors' Remuncration Director's remuncration -10,708.528.00 Audit Fee Paid by Consolidated Entity Audit of the Group's Annual Report - -4,395,475.00 Audit Fee Paid by Consolidated Entity Audit of subsidiaries, joint ventures an -9,152,366.00 Audit Fee for Non-audit Paid by Cons Audit-related assurance services - KPM -4,676,287.00 Audit Foe for Non-audit Paid by Cons Other assurance services - KPMG -2,403.796.00 Audit Foc for Non-audit Paid by Cons Other scrvices relating to corporate fin -54.602.00 Audit Fee for Non-audit Paid by Cons All other services - KPMG -765,730.00 Expensed Provisions (other) Pension and other post-retirement obli -369,214,768.00 Other Operating Expenses All other ope ting expenses -1,417,056,682.00 Other Operating Expenses External services -6,194,747.789.00 Depreciation Depreciation and Amortisation -10,057,202.288.00 Other Amortisation Amortisation -253,510,140.00 Exploration Expenditure Exploration and evaluation expenditur -795,631,825.00 Other Expenses (outside ordinary activ Escondida industrial action -709,828,393.00 Other Expenses (outside ordinary activ Samarco dam failure -495,319,812.00 Other Expenscs (outside ordinary activ Cancellation Caroona exploration 1 213,208.528.00 Cancellation of Caroona exploration 1 213,208.528.00 Costs incurred directly by BHP Billito -106,604,264.00 Escondida industrial action -709,828,393.00 Net impairments - Goodwill and other -42,901,716.00 Net impairments - Property, plant and -208,008.320.00 Samarco dam failure - Net finance cos -165, 106,604.00 Samarco dam failure provision -49,401,976.00 Share of loss relating to the Samarco d -174,206,968.00 Withholding tax on Chilean dividends 0.00 06/2017 06/2017 06/2017 06/2017 06/2017 06/2017 06/2017 06/2017 06/2017 06/2017 06/2017 06/2017 06/2017 06/2017 06/2017 06/2017 06/2017 06/2017 06/2017 06/2017 06/2017 06/2017 06/2017 -63,702,548.00 0.00 232,709,308.00 0.00 0.00 0.00 0.00 0.00 -484 919,396.00 Actual 2017 50,729,000,000 Revenue Growth rate Cost of sales Cost of sales as a % of revenue Gross profit Operating expenses Operating exp. as a % of revenue Operating profit Taxation Profit after tax Depreciation and amortization Changes in working capital Capital expenditure Free cash flow for the firm 20,357,511,000 40.13% 30,371,489,000 23,896,260,000 47.11% 6,475,229,000 5,014,300,000 1,460,929,000 10,310,712,428 5.990,640.000Step by Step Solution
There are 3 Steps involved in it
Step: 1

Get Instant Access to Expert-Tailored Solutions
See step-by-step solutions with expert insights and AI powered tools for academic success
Step: 2

Step: 3

Ace Your Homework with AI
Get the answers you need in no time with our AI-driven, step-by-step assistance
Get Started


