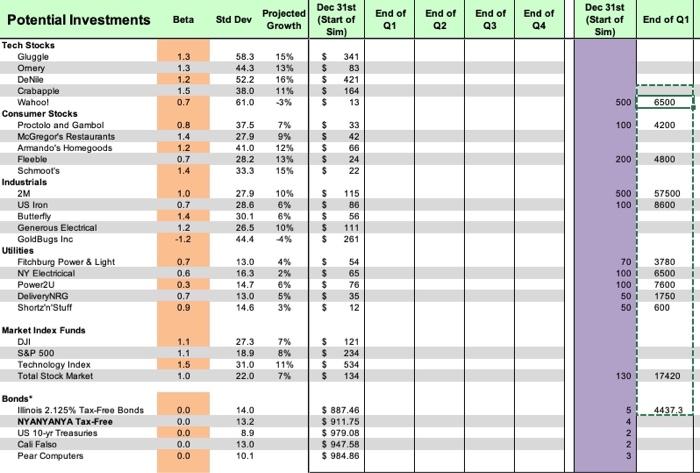
how to calculate the number of shares purchased at the end of quarter one?

Potential Investments Beta Std Dev Projected Growth Dec 31st (Start of Sim) End of Q1 End of Q2 End of Q3 End of 04 Dec 31st (Start of Sim) End of Q1 1.3 1.3 1.2 1.5 0.7 58.3 44.3 52.2 38.0 61.0 15% 13% 16% 11% 3% $ $ $ $ $ 341 83 421 164 13 500 6500 37.5 100 4200 27.9 0.8 1.4 1.2 0.7 1.4 41.0 28.2 33.3 7% 9% 12% 13% 15% $ $ $ $ $ 33 42 66 24 22 200 4800 Tech Stocks Gluggle Omery De Nile Crabapple Wahoo! Consumer Stocks Proctolo and Gambol McGregor's Restaurants Armando's Homegoods Flooble Schmoot's Industrials 2M US Iron Butterfly Generous Electrical GoldBugs Inc Utilities Fitchburg Power & Light NY Electricical Power2U DeliveryNRG Shortz'n'Stuff 500 100 57500 8600 1.0 0.7 1.4 1.2 -1.2 27.9 28.6 30.1 26.5 44.4 10% 6% 6% 10% 4% $ $ $ $ $ 115 BG 56 111 261 13.0 4% 0.7 0.6 0.3 0.7 0.9 16.3 14.7 13.0 14.6 2% 6% 5% 3% $ $ $ $ $ 54 65 76 35 12 70 100 100 50 50 3780 6500 7600 1750 600 1.1 1.1 1.5 1.0 27.3 18.9 31.0 22.0 7% 8% 11% 7% $ $ $ $ 121 234 534 134 130 17420 Market Index Funds DJI S&P 500 Technology Index Total Stock Market Bonds Illinois 2.125% Tax-Froo Bonds NYANYANYA Tax-Free US 10-yr Treasures Cali Falso Pear Computers 4437.3 0.0 0.0 0.0 0.0 0.0 14.0 13.2 8.9 13.0 10.1 $ 887.46 $ 911.75 $ 979.08 $ 947.58 $ 984.86 UNNUN Potential Investments Beta Std Dev Projected Growth Dec 31st (Start of Sim) End of Q1 End of Q2 End of Q3 End of 04 Dec 31st (Start of Sim) End of Q1 1.3 1.3 1.2 1.5 0.7 58.3 44.3 52.2 38.0 61.0 15% 13% 16% 11% 3% $ $ $ $ $ 341 83 421 164 13 500 6500 37.5 100 4200 27.9 0.8 1.4 1.2 0.7 1.4 41.0 28.2 33.3 7% 9% 12% 13% 15% $ $ $ $ $ 33 42 66 24 22 200 4800 Tech Stocks Gluggle Omery De Nile Crabapple Wahoo! Consumer Stocks Proctolo and Gambol McGregor's Restaurants Armando's Homegoods Flooble Schmoot's Industrials 2M US Iron Butterfly Generous Electrical GoldBugs Inc Utilities Fitchburg Power & Light NY Electricical Power2U DeliveryNRG Shortz'n'Stuff 500 100 57500 8600 1.0 0.7 1.4 1.2 -1.2 27.9 28.6 30.1 26.5 44.4 10% 6% 6% 10% 4% $ $ $ $ $ 115 BG 56 111 261 13.0 4% 0.7 0.6 0.3 0.7 0.9 16.3 14.7 13.0 14.6 2% 6% 5% 3% $ $ $ $ $ 54 65 76 35 12 70 100 100 50 50 3780 6500 7600 1750 600 1.1 1.1 1.5 1.0 27.3 18.9 31.0 22.0 7% 8% 11% 7% $ $ $ $ 121 234 534 134 130 17420 Market Index Funds DJI S&P 500 Technology Index Total Stock Market Bonds Illinois 2.125% Tax-Froo Bonds NYANYANYA Tax-Free US 10-yr Treasures Cali Falso Pear Computers 4437.3 0.0 0.0 0.0 0.0 0.0 14.0 13.2 8.9 13.0 10.1 $ 887.46 $ 911.75 $ 979.08 $ 947.58 $ 984.86 UNNUN


