

Answered step by step
Verified Expert Solution
Question
1 Approved Answer
How to do (c)? 1. The data set UN11 in the alr4 package contains several variables, including ppgdp, per capita gross domestic product in US
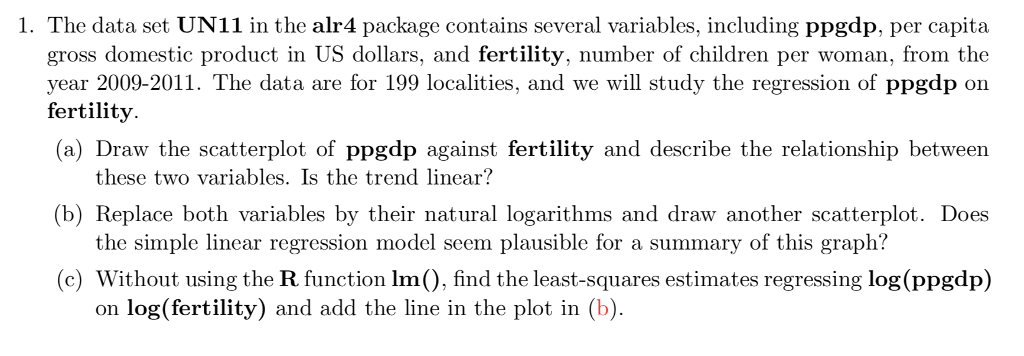
How to do (c)?
1. The data set UN11 in the alr4 package contains several variables, including ppgdp, per capita gross domestic product in US dollars, and fertility, number of children per woman, from the year 2009-2011. The data are for 199 localities, and we will study the regression of ppgdp on fertility (a) Draw the scatterplot of ppgdp against fertility and describe the relationship between these two variables. Is the trend linear? (b) Replace both variables by their natural logarithms and draw another scatterplot. Does the simple linear regression model seem plausible for a summary of this graph? (c) Without using the R function Im(), find the least-squares estimates regressing log(ppgdp) on log(fertility) and add the line in the plot in (b)Step by Step Solution
There are 3 Steps involved in it
Step: 1

Get Instant Access to Expert-Tailored Solutions
See step-by-step solutions with expert insights and AI powered tools for academic success
Step: 2

Step: 3
Ace Your Homework with AI
Get the answers you need in no time with our AI-driven, step-by-step assistance
Get Started
Linked Data A Geographic Perspective
Authors: Glen Hart, Catherine Dolbear
1st Edition
1000218910, 9781000218916