Answered step by step
Verified Expert Solution
Link Copied!

Question

1 Approved Answer

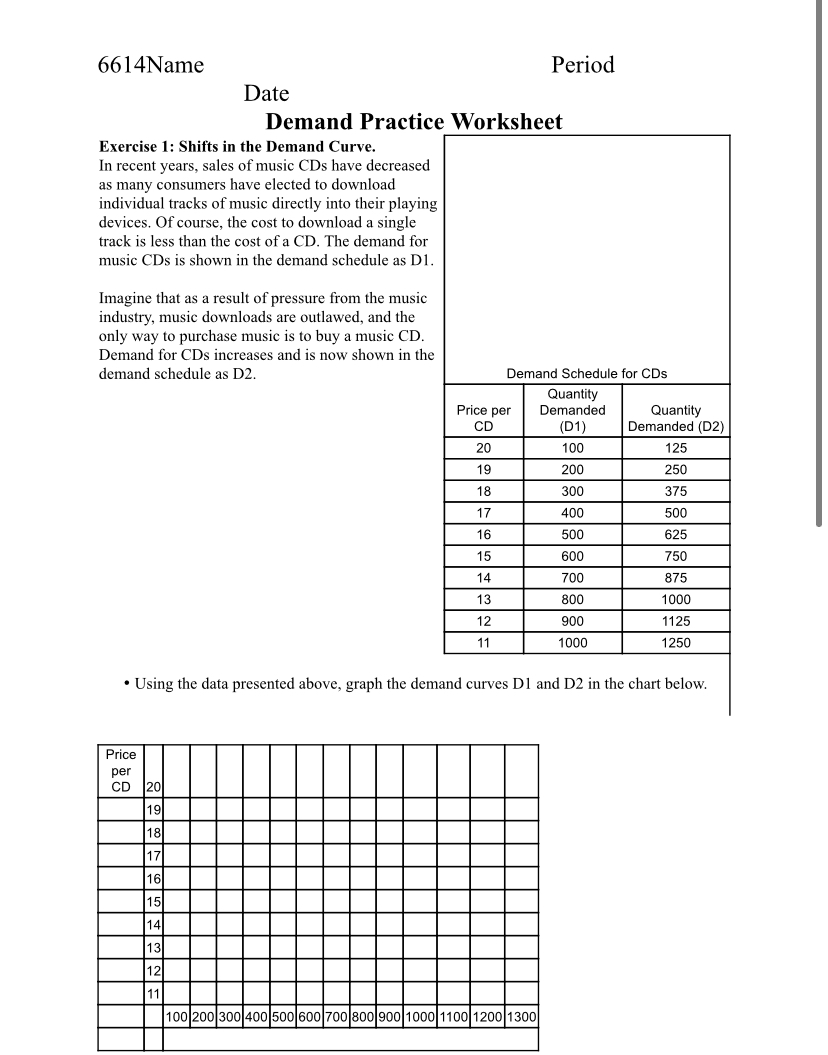
how to do graph 6614Name Period Date Demand Practice Worksheet Exercise 1: Shifts in the Demand Curve. In recent years, sales of music CDs have

how to do graph

image text in transcribed
6614Name Period Date Demand Practice Worksheet Exercise 1: Shifts in the Demand Curve. In recent years, sales of music CDs have decreased as many consumers have elected to download individual tracks of music directly into their playing devices. Of course, the cost to download a single track is less than the cost of a CD. The demand for music CDs is shown in the demand schedule as DI. Imagine that as a result of pressure from the music industry, music downloads are outlawed, and the only way to purchase music is to buy a music CD. Demand for CDs increases and is now shown in the demand schedule as D2. Demand Schedule for CDs Quantity Price per Demanded Quantity CD (D1) Demanded (D2) 20 100 125 19 200 250 18 300 375 17 400 500 16 500 625 15 600 750 14 700 375 13 800 1000 12 900 125 11 1000 1250 . Using the data presented above, graph the demand curves DI and D2 in the chart below. Price per CD 100 200 300 400 500 600 700 800 900 1000 1100 1200 1300

Step by Step Solution

There are 3 Steps involved in it

Step: 1

blur-text-image

Get Instant Access to Expert-Tailored Solutions

See step-by-step solutions with expert insights and AI powered tools for academic success

Step: 2

blur-text-image

Step: 3

blur-text-image

Ace Your Homework with AI

Get the answers you need in no time with our AI-driven, step-by-step assistance

Get Started

Recommended Textbook for

International economics

Authors: Robert J. Carbaugh

13th Edition

978-1439038949, 1439038945, 978-8131518823

More Books

Students also viewed these Economics questions