How to do Market Performance Ratios in the Attached figure?
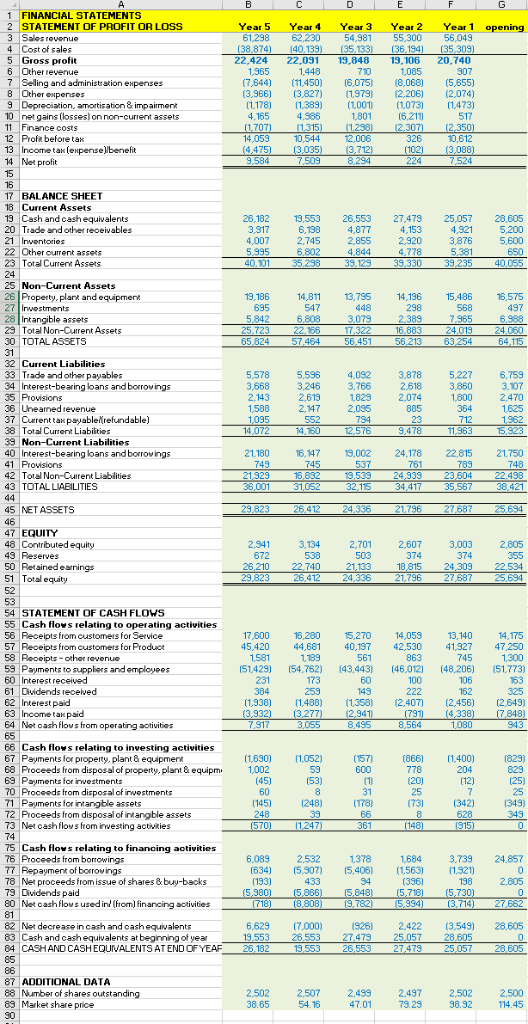
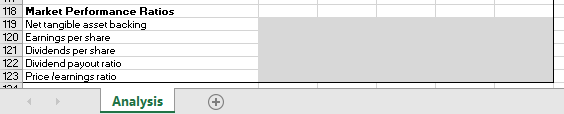
1 FINANCIAL STATEMENTS 2 STATEMENT OF PROFIT OR LOSS Year 5 Year 4 Year 3 Year 2 Year 1 opening 61,298 62,230 54,981 55,300 56,049 4 Cost of sales 5 Gross profit 6 22,424 22,031 19,848 19.106 20,740 Other revenue 7 Selling and administration epenses 7,644) (11,450) 6,075) (8,068) (5,655) (3,966) ( 1.178) .389) (1001 (1073) 1,473) (3,827) 1979)2,206) (2,074) 9 Depreciation, amortisation & impairment 10 net gains (losses) on non-current assets 11 Finance costs ,707) 1) 1238) 2.307) 2,350) 14,059 (4,475)3,035 (3,712) 12 Prof before tak (102) (3,088) 1 BALANCE SHEET 18 Current Assets 19 Cash and cash equivalents 20 Trade and other receivables 19,553 26,553 27,479 25,057 28,605 3876 S200 40. 35,238 39,129 39,330 3,235 40,055 22 Other current assets 23 Total Current Assets 25 Non-Current Assets 2 Property. plank and equipment 4,811 13,795 02 2 29 Total Non-Current Assets 30 TOTALASSETS 31 32 Current Liabilities 3Trade and oth payables 4 Interest-bearing bans andborrowing 35 Provisions 38 Uheaned revenue 7 Curent taxpayablerefundable) 38 Total Current Liabiltios 3 Non-Current Liabilities 40 Interest-bearing loans andborovings 41 Proisions 42 Total Non-Current Liablities 43 TOTALLIABILITIES 5.578 5,596 4,092 3,878 5.2276,759 2,618 1,5882,47 2,03s 14,072 ,150 2,576 9,478 11,963 15,923 21.180 16,14713,002 24,178 22.815 21750 21,329 1,82 19,539 24,939 23,604 22,438 45 NET ASSETS 47 EQUITY 48 Contributed equity 2.9413,13470 2,607 3,003 2,805 672 50 Retained earnings 51 Total equity 52 26,210 22,740 21,133 18,815 24,309 22,534 54 STATEMENT OF CASH FLOWS 55 Cash flovs relating to operating activities 56 Receipts from customeis for Service 57 Receipts from customers for Product 17,600 ,280 15,270 14,059 13,14014,175 45,420 44,681 40,197 42,530 41,927 47,250 59 Payments to supplies andemployeos 60 Interest received 61 Dividends recelved 51,429) 154,762) 43,443 (46,012) (48,206) S1,T73) (1,938) [1,488) (1,358) (2,407) (2,456) (2,649) 64 Net oash flows from operating sotivities 66 Cash flows relating to investing activities 67 Payments for propety, plant & equipmen 68 Proceeds from disposal of property, plant&equipm1,002 (1,690) 1052) (157) (86 400 829) 778 (10) 31 0 Proceeds from disposal of inwestments 71 Payments for intangble assets 72 Proceeds from disposal of intangble assets 73 Net cashflows from investing actvties 25 75 Cash lows relating to finanoing aotivities 76 Proceeds from borrowings 77 Repayment of borrovings 78 Net proceeds from issue of shaes &buy-backs 79 Dividends paid 80 Net oash flows usedinfrom)financing sotivities 18) (8808) 9 782) 5,994) 3 714) 27 662 81 82 Net decrease in cash and cash equivalents 83 Cashand cashequivalents at beginning ofyea19553 26553 274T9 25,057 28605 04 CASH AND CASHEQUIVALENTS AT END OF- 26 553- .79 557 8605 6,0892532 1378 1684 3,739 24.857 (634) (5,307) (5.406) (1563) 1.321) (5,980) (5866) 5,848) 5,718) 5,730) 6,629 7,000) 2 2.422 (3,549) 28.605 87 ADDITIONAL DATA 88 Number of shares outstanding 89 Market share price 2,5022.507 4 2.497 2502 2.500 38.65 5416 7.01 79.29 98.32 14.45 118 Market Performance Ratios 113 Net tangible asset backing 120 Earnings per share 121 Dividends per share 22 Dividend payout ratio 123 Price learnings ratio Analysis 1 FINANCIAL STATEMENTS 2 STATEMENT OF PROFIT OR LOSS Year 5 Year 4 Year 3 Year 2 Year 1 opening 61,298 62,230 54,981 55,300 56,049 4 Cost of sales 5 Gross profit 6 22,424 22,031 19,848 19.106 20,740 Other revenue 7 Selling and administration epenses 7,644) (11,450) 6,075) (8,068) (5,655) (3,966) ( 1.178) .389) (1001 (1073) 1,473) (3,827) 1979)2,206) (2,074) 9 Depreciation, amortisation & impairment 10 net gains (losses) on non-current assets 11 Finance costs ,707) 1) 1238) 2.307) 2,350) 14,059 (4,475)3,035 (3,712) 12 Prof before tak (102) (3,088) 1 BALANCE SHEET 18 Current Assets 19 Cash and cash equivalents 20 Trade and other receivables 19,553 26,553 27,479 25,057 28,605 3876 S200 40. 35,238 39,129 39,330 3,235 40,055 22 Other current assets 23 Total Current Assets 25 Non-Current Assets 2 Property. plank and equipment 4,811 13,795 02 2 29 Total Non-Current Assets 30 TOTALASSETS 31 32 Current Liabilities 3Trade and oth payables 4 Interest-bearing bans andborrowing 35 Provisions 38 Uheaned revenue 7 Curent taxpayablerefundable) 38 Total Current Liabiltios 3 Non-Current Liabilities 40 Interest-bearing loans andborovings 41 Proisions 42 Total Non-Current Liablities 43 TOTALLIABILITIES 5.578 5,596 4,092 3,878 5.2276,759 2,618 1,5882,47 2,03s 14,072 ,150 2,576 9,478 11,963 15,923 21.180 16,14713,002 24,178 22.815 21750 21,329 1,82 19,539 24,939 23,604 22,438 45 NET ASSETS 47 EQUITY 48 Contributed equity 2.9413,13470 2,607 3,003 2,805 672 50 Retained earnings 51 Total equity 52 26,210 22,740 21,133 18,815 24,309 22,534 54 STATEMENT OF CASH FLOWS 55 Cash flovs relating to operating activities 56 Receipts from customeis for Service 57 Receipts from customers for Product 17,600 ,280 15,270 14,059 13,14014,175 45,420 44,681 40,197 42,530 41,927 47,250 59 Payments to supplies andemployeos 60 Interest received 61 Dividends recelved 51,429) 154,762) 43,443 (46,012) (48,206) S1,T73) (1,938) [1,488) (1,358) (2,407) (2,456) (2,649) 64 Net oash flows from operating sotivities 66 Cash flows relating to investing activities 67 Payments for propety, plant & equipmen 68 Proceeds from disposal of property, plant&equipm1,002 (1,690) 1052) (157) (86 400 829) 778 (10) 31 0 Proceeds from disposal of inwestments 71 Payments for intangble assets 72 Proceeds from disposal of intangble assets 73 Net cashflows from investing actvties 25 75 Cash lows relating to finanoing aotivities 76 Proceeds from borrowings 77 Repayment of borrovings 78 Net proceeds from issue of shaes &buy-backs 79 Dividends paid 80 Net oash flows usedinfrom)financing sotivities 18) (8808) 9 782) 5,994) 3 714) 27 662 81 82 Net decrease in cash and cash equivalents 83 Cashand cashequivalents at beginning ofyea19553 26553 274T9 25,057 28605 04 CASH AND CASHEQUIVALENTS AT END OF- 26 553- .79 557 8605 6,0892532 1378 1684 3,739 24.857 (634) (5,307) (5.406) (1563) 1.321) (5,980) (5866) 5,848) 5,718) 5,730) 6,629 7,000) 2 2.422 (3,549) 28.605 87 ADDITIONAL DATA 88 Number of shares outstanding 89 Market share price 2,5022.507 4 2.497 2502 2.500 38.65 5416 7.01 79.29 98.32 14.45 118 Market Performance Ratios 113 Net tangible asset backing 120 Earnings per share 121 Dividends per share 22 Dividend payout ratio 123 Price learnings ratio Analysis