how to do that capsim comp-xm exam of 5 rounds this is first one anyone pleasehelp me with therounds I have to do for this assignment?
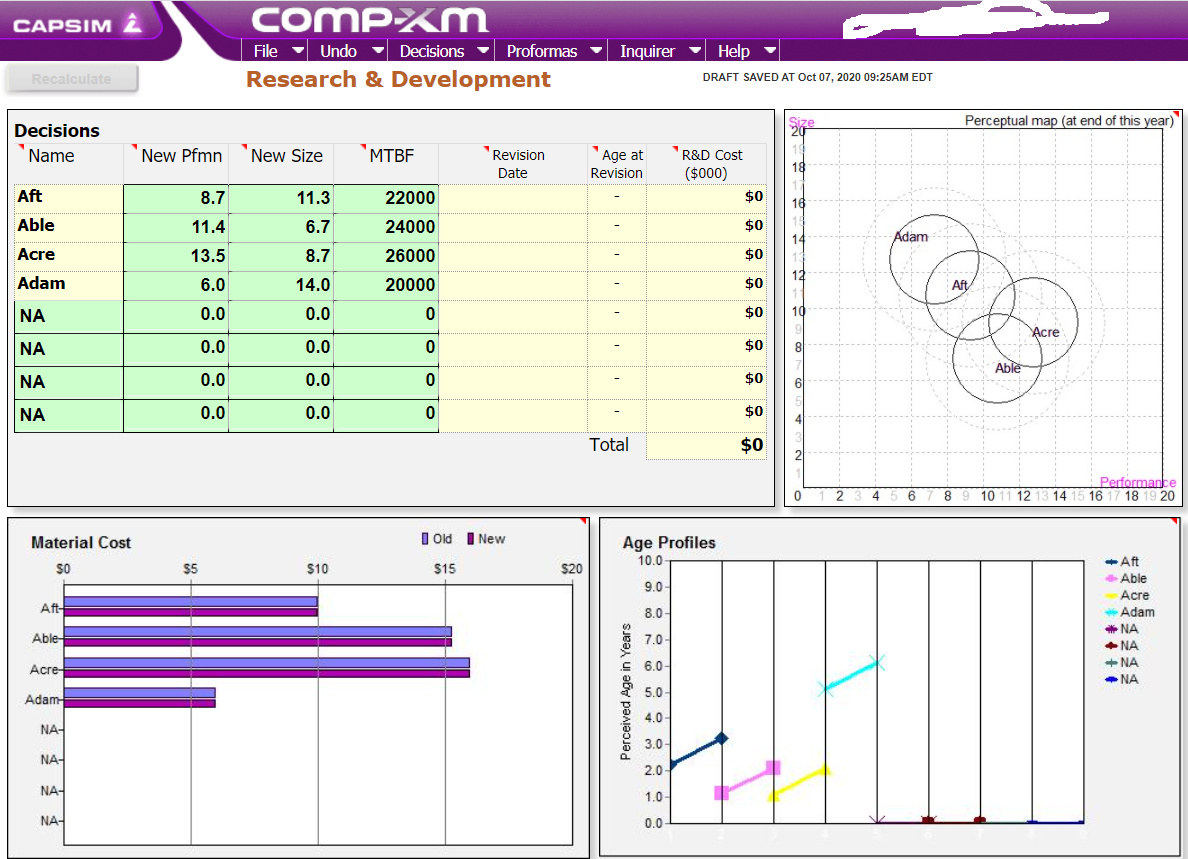
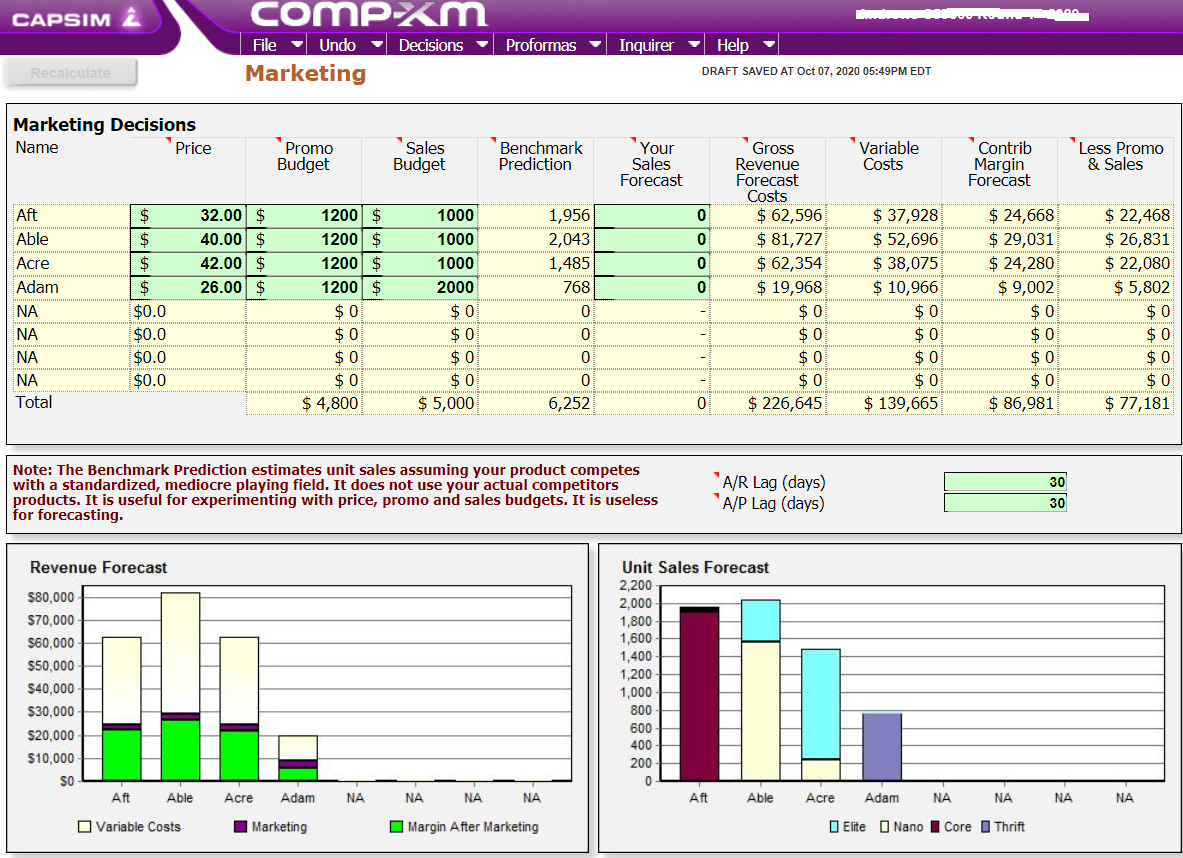
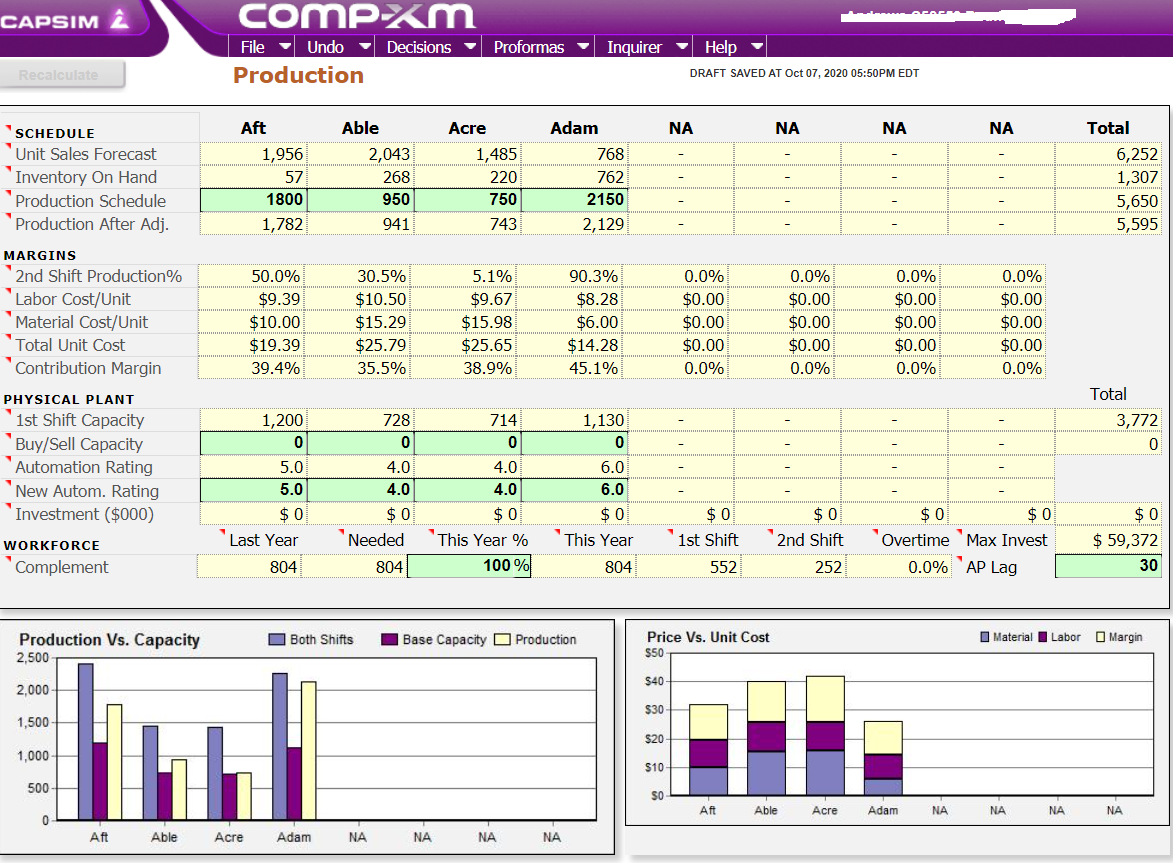
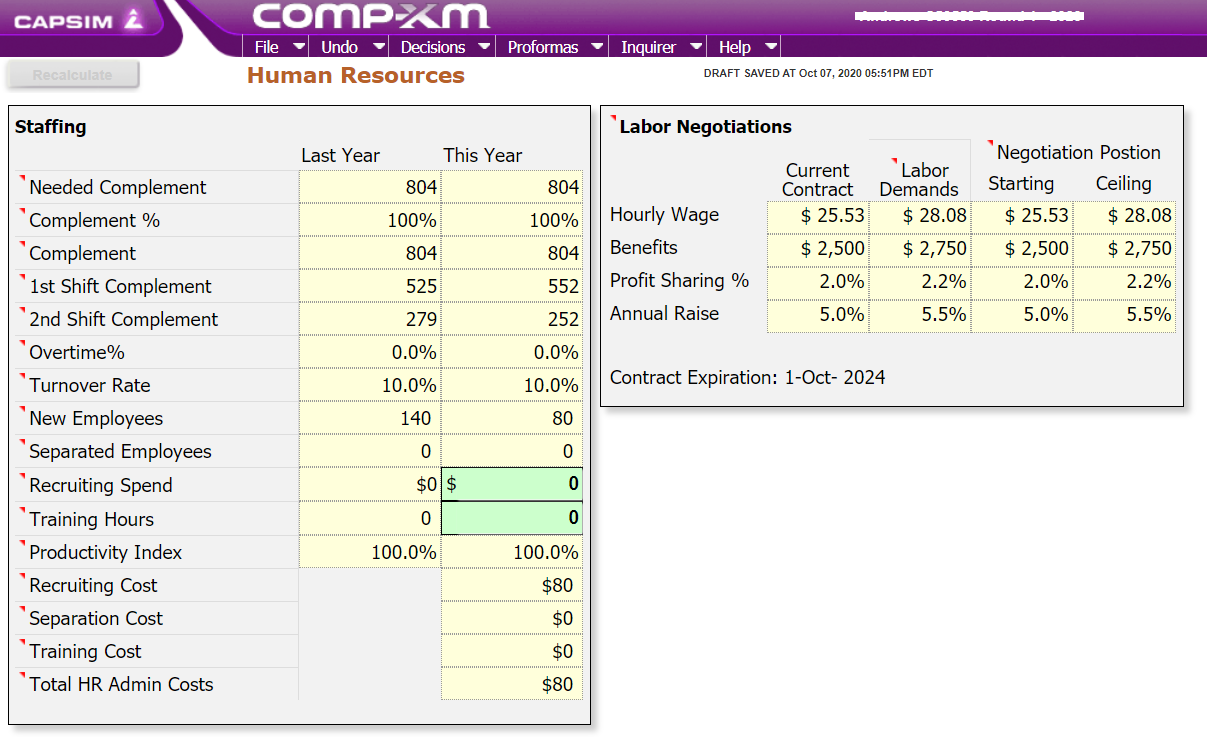
CAPSIM Z compxm File Undo Decisions Proformas Inquirer Help Recalculate Research & Development DRAFT SAVED AT Oct 07, 2020 09:25AM EDT Decisions Perceptual map (at end of this year) `Name New Pfmn New Size `MTBF "Revision `Age at "R&D Cost Date Revision ($000) 18 Aft 8.7 11.3 22000 $0 16 Able 11.4 6.7 24000 $0 Acre 13.5 B.7 26000 $0 Adam 6.0 14.0 20000 $0 NA 0.0 0.0 0 $0 NA 0.0 0.0 0 $0 CO NA 0.0 0.0 0 $0 NA 0.0 0.0 0 $0 Total $0 N 2 4 5 6 Performance 8 9 10 11 12 13 14 15 16 17 18 19 20 Material Cost I Old I New Age Profiles SO $5 $10 $15 $20 10.0 + Aft 9.0 Able - Acre Att 8.0- Adam Able Perceived Age in Years 7.0 # NA + NA Acre 6.0 + NA NA Adam 5.0 4.0 NA- NA- 2.0 NA- 1.0 NAY 0.0CAPSIM Z compxm File Undo Decisions Proformas Inquirer Help Recalculate Marketing DRAFT SAVED AT Oct 07, 2020 05:49PM EDT Marketing Decisions Name Price "Promo Sales Budget Budget Benchmark Your Gross Prediction Sales Revenue 'Variable "Contrib Costs `Less Promo Forecast Forecast Margin & Sales Costs Forecast Aft 32.00 $ 1200 $ 1000 1,956 O $ 62,596 $ 37,928 $ 24,668 Able 40.00 $ $ 22,468 1200 $ 1000 2,043 0 $ 81,727 $ 52,696 $ 29,031 Acre 42.00 $ $ 26,831 1200 $ 1000 1,485 0 $ 62,354 Adam $ $ 38,075 $ 24,280 $ 22,080 26.00 $ 1200 $ 2000 768 0 $ 19,968 $ 10,966 $ 9,002 $ 5,802 NA $0.0 $0 $ 0 0 $ 0 $ 0 $0 NA $0.0 $0 $ 0 $ 0 0 $0 $ 0 NA $0 $0.0 $0 $0 $0 $0 NA $0.0 $ 0 $0 $0 $ 0 $ 0 $0 Total $ 0 $ 0 $0 $ 4,800 $ 5,000 6,252 $ 226,645 $ 139,665 $ 86,981 $ 77,181 Note: The Benchmark Prediction estimates unit sales assuming your product competes with a standardized, mediocre playing field. It does not use your actual competitors products. It is useful for experimenting with price, promo and sales budgets. It is useless "A/R Lag (days) 30 for forecasting. "A/P Lag (days) 30 Revenue Forecast Unit Sales Forecast $80,000 2,200 $70,000 2,000 1,800 $60,000 1,600 $50,000 1,400 $40,000 1,200 1,000 $30,000 800 $20,000 600 $10,000 400 200 SO Aft Able Acre Adam NA NA NA NA Aft Able Acre Adam NA NA NA NA OVariable Costs Marketing Margin After Marketing Elite Nano Core O ThriftCAPSIM Z compxm File Undo Decisions |Proformas Inquirer * Help Recalculate Production DRAFT SAVED AT Oct 07, 2020 05:50PM EDT `SCHEDULE Aft Able Acre Adam NA NA NA NA Total `Unit Sales Forecast 1,956 2,043 1,485 768 Inventory On Hand 57 268 5,252 220 762 Production Schedule 1800 950 750 1,307 2150 Production After Adj. 5,650 1,782 941 743 2,129 5,595 MARGINS `2nd Shift Production% 50.0% 30.5% 5.1% 90.3% 0.0% 0.0% 0.0% 0.0% `Labor Cost/Unit $9.39 $10.50 $9.67 $8.28 $0.00 $0.00 $0.00 `Material Cost/Unit $0.00 $10.00 $15.29 $15.98 $6.00 $0.00 $0.00 $0.00 $0.00 `Total Unit Cost $19.39 $25.79 $25.65 $14.28 $0.00 $0.00 $0.00 Contribution Margin $0.00 39.4% 35.5% 38.9% 45.1% 0.0% 0.0% 0.0% 0.0% PHYSICAL PLANT Total `1st Shift Capacity 1,200 728 714 1,130 Buy/Sell Capacity 0 0 3,772 0 0 0 Automation Rating 5.0 4.0 4.0 6.0 `New Autom. Rating 5.0 4.0 4.0 6.0 Investment ($000) $0 $ 0 $ 0 $ 0 $ 0 $ 0 5 0 $0 $0 WORKFORCE Last Year `Needed `This Year % This Year 1st Shift `2nd Shift `Overtime Max Invest $ 59,372 Complement 804 804 100% 804 552 252 0.0% AP Lag 30 Production Vs. Capacity Both Shifts Base Capacity Production Price Vs. Unit Cost Material Labor )Margin 2,500 $50 2,000 $40 1,500 $30 1,000 51 500 SO Aft Able Acre Adam NA NA NA NA Aft Able Acre Adam NA NA NA NACAPSIM Z compxm File * Undo Decisions Proformas Inquirer Help Recalculate Human Resources DRAFT SAVED AT Oct 07, 2020 05:51PM EDT Staffing Labor Negotiations Last Year This Year Current `Labor `Negotiation Postion `Needed Complement 804 804 Contract Demands Starting Ceiling Complement % 100% 100% Hourly Wage $ 25.53 $ 28.08 $ 25.53 $ 28.08 Complement 804 804 Benefits $ 2,500 $ 2,750 $ 2,500 $ 2,750 `1st Shift Complement 525 552 Profit Sharing % 2.0% 2.2% 2.0% 2.2% 2nd Shift Complement 279 252 Annual Raise 5.0% 5.5% 5.0% 5.5% Overtime% 0.0% 0.0% `Turnover Rate 10.0% 10.0% Contract Expiration: 1-Oct- 2024 New Employees 140 80 `Separated Employees 0 0 `Recruiting Spend $0 $ 0 `Training Hours 0 0 `Productivity Index 100.0% 100.0% `Recruiting Cost $80 `Separation Cost $0 `Training Cost $0 `Total HR Admin Costs $80CAPSIM Z compxm File Undo Decisions Proformas Inquirer Help Recalculate Finance DRAFT SAVED AT Oct 07, 2020 05:52PM EDT Finances Liabilities & Owner's Equity Common Stock PLANT IMPROVEMENTS `Total Investments ($000) $ 0 Sales Of Plant & Equipment $ 0 Retained Earnings COMMON STOCK Long Term Debt `Shares Outstanding (000) 2,051 Price Per Share $ 95.28 Current Debt Earnings Per Share $ 12.38 Accounts Payable Max Stock Issue ($000) $ 39,084 Issue Stock ($000) `Max Stock Retire ($000) $ 9,771 Long Term Debt Retire Stock ($000) 0 `Retire Long Term Debt ($000) `Issue Long Term Debt ($000) Dividend Per Share 0.00 `Long Term Interest Rate 11.4% $ 14,722 CURRENT DEBT "Maximum Issue This Year "A/R Lag (days) Interest Rate 10.0% 30 "A/P Lag (days) 30 `Due This Year $ 15,717 Borrow ($000) Outstanding Bonds CASH POSITIONS Series Number "Face Amount $0 Current Yield 2019 Close December 31, 2019 $ 31,330 13.552021 $ 11,300 13.0% $ 103.58 11.252026 $ 8,837 11.3% $ 99.07 December 31, 2020 $ 41,322 11.952027 $ 7,072 11.6% $ 102.54CAPSIM Z comp.xm File Undo Decisions Proformas Inquirer Help Recalculate TOM Initiative DRAFT SAVED AT Oct 07, 2020 05:53PM EDT Process Management Initiatives Projected Impact "Budget ($000) `CPI Systems Total Current Expenditures ($000) : $0 `Vendor/JIT `Quality Initiative Training PROJECTED CUMULATIVE IMPACTS Worst Case Best Case `Channel Support Systems Material Cost Reduction 0.0% 0.0% Concurrent Engineering Labor Cost Reduction 0.0% 0.0% UNEP Green Programs Reduction R&D Cycle Time 0.0% 0.0% TQM INITIATIVES Reduction in Admin Costs 0.0% 0.0% Benchmarking Demand increase 0.0% 0.0% Quality Function Deployment Effort `CCE/6 Sigma Training GEMI TQEM Sustainability Initiatives Reduction in Cost of Goodsterial La Admin Cost Reductions R&D Cycle Time Reductions Demand Increase For the Year Just Ended For the Year Just Ended For the Year Just Ended For the Year Just Ended 1.0% 0% 209 0% 109 0% Andrews Andrews Andrews Baldwin 0.5% Baldwin Baldwin Chester Chester Chester 0.0% Digby Digby Digby Andrews Baldwin Chester Digby10/8/2020 Report Page Top Annual Report Andrews C59559 Round: 0 Dec. 31, 2019 Balance Sheet DEFINITIONS: Common Size: The common size column ASSETS 2019 2018 simply represents each item as a percentage of total assets for that year. Cash: Your end-of-year cash position. Common Accounts Receivable: Reflects the lag between delivery Cash and payment of your products. Inventories: The current Accounts Receivable $31,330 Size 25.4% 10.90 $31,792 value of your inventory across all products. A zero indicates Inventory 1 3% $13,441 your company stocked out. Unmet demand wo demand would, of course $26,295 $14,875 all to your competitors. Plant & Equipment: The current value of your plant. Accum Depreci The total accumulated Total Current Asset $71,038 57.5% $60,108 depreciation from your plant. Accts Payal cts Payable: What the company currently owes suppliers for materials and Plant & Equipment 36.0% $93,304 Current Debt: The debt the company is obligated Accumulated Depreciation $96,824 $44,409) $37,954) to pay during the next year of operations. It includes emergency loans used to keep your company solvent sh Total Fixed Assets $52,415 42.5% $55,350 you run out of cash during the year. Long company's long term debt is in the form of bonds m Debt: The Total Assets $123,452 100.0% $115,458 represents the total value of your bonds. Common Stock: The amount of capital invested by shareholders in the LIABILITIES & OWNERS' EQUITY company. Retained Earnings: The profits that the company chose to keep instead of paying to shareholders as dividends. Accounts Payable Current Debt $9,516 $15,717 $27,209 12.7% 26,18 Long Term Debt 22.0% $34.742 Total Liabilities $52,442 42.5% $49,248 Common Stock Retained Earnings $12,080 $58,92 9.8% 17.7% $12,443 $53,766 Total Equity $71,009 57.50 $66,209 Total Liab. & O. Equity $123,452 100.0% $115,458 Cash Flow Statement he Cash Flow Statement examines what happened in the Cash Account during the a Cash Flows from Operating Activities: year. Cash injections appear as positive numbers and cash withdrawals as negative statement is an excellent tool f cellent tool for diagnosing emergency loans Net Income (Loss) Depreciation $20,069 2018 21,773 When negative cash flows exceed positives, you are forced to seek emergency fun Extraordinary gains/losses/writeoffs $6,455 SO For example, if sales are bad and you find yourself carrying an abundance of excess Accounts Payable inventory, the report would show the increase in inventory as a huge negative cash flow. Inventory ($11,420) $2,083 much unexpected inventory could outstrip your inflows, exhaust your starting cash and Accounts Receivable $28 $2'889 orce you to beg for money to keep your company afloat. Net cash from operations Cash Flows from Investing Activities: $15,867 $23,115 Cash Flow Summary Plant Improvements ($3,520) Andrews Cash Flows from Financing Activities: ($1,820) Dividends Paid Sales of Common Stock ($13,334) ($7,949) 15,000 Purchase of Common Stock ($541) Cash from long term debt $1,935) 10,000 Retirement of long term debt $7,533) Change in current debt (net) $9,992 $2,070) 5,000 Net cash from financing activities Net change in cash position $12,810) ($10.560 Closing cash position $31,330 $31,792 -5,000 -10,000 Operations Finance Chg. Cash Operations Investment ) Finance O Chg. Cash Annual Report Page 1 https://ww2.capsim.com/cgi-bin/displayReport.cfm?Report=AnnReport 2/1210/8/2020 Report Page Top Annual Report Andrews C59559 Round: 0 Dec. 31, 2019 2019 Income Statement (Product Name:) Aft Able Acre Adam Na Na 2019 Common Sales $58,430 $36,823 $32,397 $35,540 SO So Total $163, 189 100.0% Variable Costs: Direct Labor Direct Material $16,269 $21.852 $14 341 $7.611 $10,795 $11,526 $44,095 6.9% Inventory Carr $689 Total Variable $143 $38,264 $830 $24,591 $20.849 $1,493 8868 8868 60,268 23,814 $3,1 1.9% 65.9% Contribution Margin $20,16 $12,232 $11,548 $11,726 $0 SO 8868 SO 8 8868 $55,671 34.1% Period Costs Depreciation SG&A: R&D $2,080 $0 $1,068 $869 $1,047 $881 $2,260 $0 $6,455 Promotions $1,200 $1,200 Sales $1 090 $729 $1,000 $1,200 $1,200 886888 868868 $4,800 $2,000 Admin 888888 $1 283 0.8% Total Period $4,739 54.426 $4,382 5,739 $19 287 11 8% Net Margin $15,426 $7.805 $7, 166 $5,987 $0 $36,384 22.3% Definitions: Sales: Unit sales times list price. Direct Labor: Labor costs incurred to produce the product that was sold. st. the cost to carry unsold goods in inventory. Depreciation: Calculated on straight-line 15-year Other 2 29 $36,355 0.0 70 22.3% overhead holdon of plant value. R&D Costs: R&D department expenditures for each product. Admin. Ad! The sales for s estimated at 1.5% of sales. Promotions: The promotion budget for each product. Sales: The sales force Short Term Interest $1,493 each product. Other: er: Charges not included in other categories such as Fees, Write Offs, and TQM. The fees Long Term Interest $3,357 2.1% include money paid to investment bankers and brokerage firms to issue new stocks or bonds plus consulting fees Taxes $11,027 6.8% instructor might assess. Write-offs include the clude the loss you might experience when you sell capacity or liquidate inventory as Profit Sharing the result of eliminating a production line. If the amount appears as a negative amount, then you actually made money on Net Profit $20.069 0.3% 12.3% ation of capacity or inventory. EBIT: Earnings Before Interest and Taxes. Short Term Interest: Interest expense based on last year's current debt, including short term debt, long term notes that have become due, and emergency loans. Long Term Interest: Interest paid on outstanding b standing bonds. Taxes: Income tax based upon a 35% tax rate. Profit Variable Margins Sharing: Profits shared with employees under the labor contract. Net Profit: EBIT minus interest, taxes, and profit 2008 Andrews sharing. 30.0% 20.0% 10.0% 0.0% Able Acre Adam 2 2 Na Profit History Market Share History $20,000 30% $15,000 $10,000 20% $5,000 10% SO 0% 2015 2016 2017 2018 2019 2015 2016 2017 2018 2019 ROE History Asset Turnover History 30% 20% 1.0 10% 0.5 0% 0.0 2015 2016 2017 2018 2019 2015 2016 2017 2018 2019 ROS History ROA History 10% 15.0% 10.0% 5% 5.0% 0% 0.0% 2015 2016 2017 2018 2019 2015 2016 2017 2018 2019 Annual Report Page 2 PRINT https://ww2.capsim.com/cgi-bin/displayReport.cfm?Report=AnnReport 3/1210/8/2020 Report Page Top Annual Report Baldwin C59559 Round: 0 Dec. 31, 2019 Balance Sheet DEFINITIONS: Common Size: The common size column ASSETS 2019 2018 simply represents each item as a percentage of total assets for that year. Cash: Your end-of-year cash position. Common Accounts Receivable: Reflects the lag between delivery Cash Accounts Receivable $20,201 Size $9,820 COZ 6 and payment of your products. Inventories: The current 21.6% value of your inventory across all products. A zero indicates Inventory 10.5% 5.0% $8,045 $15,341 your company stocked out. Unmet demand wa $14,051 demand would, of course all to your competitors. Plant & Equipment: The current value of your plant. Accum Depreci The total accumulated Total Current Asset $44,072 47.2% $32,591 depreciation from your plant. Accts Payal cts Payable: What the company currently owes suppliers for materials and Plant & Equipment Accumulated Depreciation $84,380 0.39 Current Debt: The debt the company is obligated $35,023) 7.5 $77,880 $29,397) to pay during the next year of operations. It includes emergency loans used to keep your company solvent sh Total Fixed Assets $49,357 52.8% $48,483 you run out of cash during the year. Long company's long term debt is in the form of bonds m Debt: The Total Assets $93,430 100.0% $81,073 represents the total value of your bonds. Common Stock: The amount of capital invested by shareholders in the LIABILITIES & OWNERS' EQUITY company. Retained Earnings: The profits that the company chose to keep instead of paying to shareholders as Accounts Payable $6,288 dividends. Current Debt Long Term Debt $18,177 6.1 0 $19,548 19.5% $5,513 20.90 $10,851 $20,006 Total Liabilities $44,013 47.1% $36,370 Common Stock Retained Earnings $9,082 $40,335 3.2% $9,498 35,205 Total Equity $49,417 52.9% $44,703 Total Liab. & O. Equity $93,43 100.0% $81,073 Cash Flow Statement he Cash Flow Statement examines what happened in the Cash Account during the a as positive numbers and cash withdrawals as non Cash Flows from Operating Activities: year. Cash injections appear as positive numbers and ca statement is an excellent tool f Net Income (Loss) 2018 cellent tool for diagnosing emergency loans Depreciation Extraordinary gains/losses/writeoffs $5,625 $5, 192 gative cash flows exceed positives, you are forced to seek emergency fun For example, if sales are bad and you find yourself carrying an abundance of excess Accounts Payable inventory, the report would show the increase in inventory as a huge negative cash flow. Inventory $775 $O ($223) much unexpected inventory could outstrip your inflows, exhaust your starting cash and Accounts Receivable ($1,775) ($4,577 orce you to beg for money to keep your company afloat. Net cash from operations Cash Flows from Investing Activities: $17,090 $8,742 Cash Flow Summary Plant Improvements Cash Flows from Financing Activities: ($6,500) ($12,220) Baldwin Dividends Paid Sales of Common Stock ($4,505) ($4, 189) Purchase of Common Stock 15,000 Cash from long term debt $5,881 $1, 144) Retirement of long term debt $2,36 $6,339) Change in current debt (net) $7.326 $900 10,000 Net cash from financing activities 5,000 Net change in cash position $407 $ 10,997 $2,067) Closing cash position $20,201 $9,205 5,000 Operations Finance Chg. Cash Operations Investment ) Finance O Chg. Cash Annual Report Page 1 https://ww2.capsim.com/cgi-bin/displayReport.cfm?Report=AnnReport 5/1210/8/2020 Report Page Top Annual Report Baldwin C59559 Round: 0 Dec. 31, 2019 2019 Income Statement 2019 (Product Name:) Baker Bead Bid Bold Na Na Total Common Sales $33,780 $16,531 35,478 $33,685 SO So $119,474 100.0% Variable Costs: Direct Labor $6,997 $29,034 4.3 70 Direct Material $10,422 $14 524 $3,349 $6.017 $8,265 14,543 Inventory Carr $262 Total Variable $247 $25, 192 9,628 $618 $13,674 40.8% $559 $1, 686 $79,477 1.4% 23,426 $21,230 8868 8868 6.5% Contribution Margin $8,588 $6,903 $12,052 $12,455 8868 SO 8 8868 $39,998 33.50 Period Costs Depreciation $1,292 $1,213 $1,647 $5,625 SG&A: R&D $876 $963 $1,473 $939 Promotions $1,100 $1,100 $988 $1,100 Sales $400 $400 $1,100 $1,200 $1,200 $3,200 3. 70% Admin $258 $126 $271 Total Period $3,926 3.802 $5.032 5,143 886888 888888 886868 $17.903 5.0% Net Margin $4,662 $3, 101 $7,020 $7,312 $0 $22,094 18.5% Definitions: Sales: Unit sales times list price. Direct Labor: Labor costs incurred to produce the product that was sold. Inventory Carry Cost: the cost to carry unsold goo any unsold goods in inventory. Depreciation: Calculated Calculated on straight-line 15-year Other 0.3 70 BUTT $323 overhead boston of plant value. R&D Costs: R&D department expenditures for each product. Admin. Ad!The sales ford s estimated at 1.5% of sales. Promotions: The promotion budget for each product. Sales: The sales force Short Term Interest $1 781 18.2% each product. Other: er: Charges not included in other categories su such as Fees, Write Offs, and TOM. The fees Long Term Interest $2,447 Taxes $6 140 2.0% include money paid to investment bankers and brokerage firms to issue new stocks or bonds plus consulting fees 5.1% instructor might assess. Write-offs include the clude the loss you might experience when you sell capacity or liquidate inventory as Profit Sharing the result of eliminating a production line. If the amount appears as a negative amount, then you actually made money on Net Profit $228 $11,175 9:4% ation of capacity or inventory. EBIT: Earnings Before Interest and Taxes. Short Term Interest: Interest expense based on last year's current debt, including short term debt, long term notes that have become due, and emergency kes' Income tax based upon a 35% tax rate. Profit Variable Margins loans. Long Term Interest: Interest paid on outstanding bonds. Taxes: Income Sharing: Profits shared with employees under the labor contract. Net Profit: EBIT minus interest, taxes, and profit 2008 Baldwin sharing. 40.0% 30.0% 20.0% 10.0% 0.0% Baker Bead Bold 2 2 Na Profit History Market Share History $10,000 25% 20% 15% $5,000 10% 5% SO 0% 2015 2016 2017 2018 2019 2015 2016 2017 2018 2019 ROE History Asset Turnover History 20% 15% 1.0 10% 0.5 5% 0% 0.0 2015 2016 2017 2018 2019 2015 2016 2017 2018 2019 ROS History ROA History 8%% 10.0% 6% 4% 5.0% 2% 0% 0.0% 2015 2016 2017 2018 2019 2015 2016 2017 2018 2019 Annual Report Page 2 PRINT https://ww2.capsim.com/cgi-bin/displayReport.cfm?Report=AnnReport 6/1210/8/2020 Report Page Top Annual Report Chester C59559 Round: 0 Dec. 31, 2019 Balance Sheet DEFINITIONS: Common Size: The common size column ASSETS 2019 2018 simply represents each item as a percentage of total assets for that year. Cash: Your end-of-year cash position. Common Accounts Receivable: Reflects the lag between delivery Cash and payment of your products. Inventories: The current Accounts Receivable $32,404 Size 22 400 36,638 $10 , 167 7 0% your company stocked out. Unmet demand wo demand would, of course Inventory $9,773 value of your inventory across all products. A zero indic $7.926 all to your competitors. Plant & Equipment: The current value of your plant. Accum Depreci The total accumulated Total Current Asset $53,371 36.8% $54,337 depreciation from your plant. Accts Payal cts Payable: What the company currently owes suppliers for materials and Plant & Equipment $142,900 $51,265) 18.59 current Debt: The debt the company is obligated Accumulated Depreciation 35.4% $127, 100 ($41,738) to pay during the next year of operations. It includes emergency loans used to keep your company solvent sh Total Fixed Assets $91,635 63.2% $85,362 you run out of cash during the year. Long company's long term debt is in the form of bonds m Debt: The Total Assets $145,006 100.0% $139,699 represents the total value of your bonds. Common Stock: The amount of capital invested by shareholders in the LIABILITIES & OWNERS' EQUITY company. Retained Earnings: The profits that the company chose to keep instead of paying to shareholders as Accounts Payable $5,826 dividends. Current Debt Long Term Debt $29,224 $53,851 20.2% 37.1% $22.151 $51,910 Total Liabilities $90,306 62.3% $79,887 Common Stock Retained Earnings $24,695 $30,004 7.0% 20.7% $24,695 $35, 117 Total Equity $54,699 37.70 $59,812 Total Liab. & O. Equity $145,006 100.0% $139,699 Cash Flow Statement he Cash Flow Statement examines what happened in the Cash Account during the a Cash Flows from Operating Activities: 2018 year. Cash injections appear as positive numbers and cash withdrawals as negative Statement is an excellent tool cellent tool for diagnosing emergency loans Net Income (Loss) Depreciation $8.473 When negative cash flows exceed positives, you are forced to seek emergency fun Extraordinary gains/losses/writeoffs For example, if sales are bad and you find yourself carrying an abundance of excess Accounts Payable inventory, the report would show the increase in inventory as a huge negative cash flow. Inventory $1,405 $2,241) $1,026) $753 much unexpected inventory could outstrip your inflows, exhaust your starting cash and Accounts Receivable $552) orce you to beg for money to keep your company afloat. Net cash from operations Cash Flow Summary Cash Flows from Investing Activities: $15, 166 $18,284 Plant Improvements ($15,800) ($18,592) Chester Cash Flows from Financing Activities: Dividends Paid Sales of Common Stock ($12,615) ($8,875) 15,000 Purchase of Common Stock Cash from long term debt $9,475 $7,994 10,000 Retirement of long term debt $7,533) $7.073 SO 5,000 Change in current debt (net) ($5,283) Net cash from financing activities 0 Net change in cash position Closing cash position ($4 234 $6, 165) $32,404 ($64721 $36,638 -5,000 -10,000 -15,000 Operations Finance Chg. Cash Operations Investment ) Finance O Chg. Cash Annual Report Page 1 https://ww2.capsim.com/cgi-bin/displayReport.cfm?Report=AnnReport 3/1210/8/2020 Report Page Top Annual Report Chester C59559 Round: 0 Dec. 31, 2019 2019 Income Statement (Product Name:) Cake Cozy Na Na 2019 Cedar Coat Common So $131,3 Size Sales $25,397 $31,717 34,720 $39,561 SO 10.0% Variable Costs: Direct Labor Direct Material $5,405 $7,039 $9,478 $14,423 $10,563 $32,486 10.5% Inventory Carr $322 $344 $345 Total Variable $19.885 $24,246 $209 $15,096 $27,734 8868 8868 $10,474 $11,828 SO 8888 0.9% 66.2% Contribution Margin $10,30 $11,832 SO 8 8868 $44,43 33.8% Period Costs Depreciation $2,660 $3,167 $1,800 $1,900 $9,527 SG&A: R&D $958 $979 $936 $1,050 $896 $3,768 Promotions $1,050 $1,050 Sales 24090 $4,200 3.2% 6334 $800 $600 Admin $416 $600 2:3 % $520 $3,000 Total Period $6,001 $6.412 $4,842 $4,966 886888 888888 868688 522,221 5.9% Net Margin $4,300 $5.421 $5,632 $6,862 $0 $22,214 16.9% Definitions: Sales: Unit sales times list price. Direct Labor: Labor costs incurred to produce the product that was sold. inventory Carry Cost: the cost to carry unsold goo Calculated on straight-line 15-year Other $474 in: Administration s estimated at 1.5% of sales. Promotions: The promotion budget for each product. Sales: The sales force Short Term Interest $21,740 0.4 70 horror of plant value. R&D Costs: R&D department expenditures for each product. A $3,24 2.5% er: Charges not included in other categories su Long Term Interest 5.1% each product. Other: such as Fees, Write Offs, and TQM. The fees include money paid to investment bankers and brokerage firms to issue new stocks or bonds plus consulting fees Taxes 3.1% instructor might assess. Write-offs include the clude the loss you might experience when you sell capacity or liquidate inventory as Profit Sharing the result of eliminating a production line. If the amount appears as a negative amount, then you actually made money on Net Profit $7,502 0. 1% 70% ation of capacity or inventory. EBIT: Earnings Before Interest and Taxes. Short Term Interest: Interest expense based on last year's current debt, including short term debt, long term notes that have become due, and emergency itstanding bonds. Taxes: Income tax based upon a 35% tax rate. Profit Variable Margins loans. Long Term Interest: Interest paid on outstanding b Sharing: Profits shared with employees under the labor contract. Net Profit: EBIT minus interest, taxes, and profit 2008 Chester sharing. 40.0% 30.0% 20.0% 10.0% 0.0% Cedar Coat 222 Na Profit History Market Share History $10,000 30% $8,000 20% $6,000 $4,000 109 $2,000 SO 0% 2015 2016 2017 2018 2019 2015 2016 2017 2018 2019 ROE History Asset Turnover History 15% 1.0 10% 5% 0.5 0% 0.0 2015 2016 2017 2018 2019 2015 2016 2017 2018 2019 ROS History ROA History 8% 6.0% 4% 4.0% 2% 2.0% 0% 0.0% 2015 2016 2017 2018 2019 2015 2016 2017 2018 2019 Annual Report Page 2 PRINT https://ww2.capsim.com/cgi-bin/displayReport.cfm?Report=AnnReport 9/1210/8/2020 Report Page Top Annual Report Digby C59559 Round: 0 Dec. 31, 2019 Balance Sheet DEFINITIONS: Common Size: The common size column ASSETS 2019 2018 simply represents each item as a percentage of total assets for that year. Cash: Your end-of-year cash position. Common Accounts Receivable: Reflects the lag between delivery Cash $32,612 Size and payment of your products. Inventories: The current Accounts Receivable Inventory $9,778 25.9% 7.8% 26, 156 value of your inventory across all products. A zero indic $6,478 5 1% $8,808 $8.005 your company stocked out. Unmet demand wo demand would, of course all to your competitors. Plant & Equipment: The current value of your plant. Accum Depreci The total accumulated Total Current Asset $48,868 38.8% $42,969 depreciation from your plant. Accts Payal cts Payable: What the company currently owes suppliers for materials and Plant & Equipment Accumulated Depreciation $124,400 $47,289) 98.790 current Debt: The debt the company is obligated 7.50 $97.758 $38,996) to pay during the next year of operations. It includes emergency loans used to keep your company solvent sh Total Fixed Assets $77,111 61.2% $58,762 you run out of cash during the year. Long company's long term debt is in the form of bonds m Debt: The Total Assets $125,979 100.0% $101,732 represents the total value of your bonds. Common Stock: The amount of capital invested by shareholders in the LIABILITIES & OWNERS' EQUITY company. Retained Earnings: The profits that the company chose to keep instead of paying to shareholders as Accounts Payable dividends. Current Debt $5,797 4.6 70 5.255 Long Term Debt $25,509 20.2% 32.9% $15,816 $31,568 Total Liabilities $72,698 57.7% $52,639 Common Stock Retained Earnings $14,332 $38,94 1.4% 30.90 $14,332 $34,762 Total Equity $53,281 42.3% $49,094 Total Liab. & O. Equity $125,979 100.0% $101,732 Cash Flow Statement he Cash Flow Statement examines what happened in the Cash Account during the a Cash Flows from Operating Activities: year. Cash injections appear as positive numbers and cash withdrawals as negative Net Income (Loss) 1 2019 2018 Depreciation $8,293 $10,502 $6,517 When negative cash flows excee statement is an excellent tool cellent tool for diagnosing emergency loans ash flows exceed positives, you are forced to seek emergency fun Extraordinary gains/losses/writeoffs ($3) For example, if sales are bad and you find yourself carrying an abundance of excess Accounts Payable inventory, the report would show the increase in inventory as a huge negative cash flow. Inventory $1,527 $930 $956 much unexpected inventory could outstrip your inflows, exhaust your starting cash and Accounts Receivable ($970 ) $1,879 orce you to beg for money to keep your company afloat. Net cash from operations Cash Flows from Investing Activities: $19,59 $17,023 Cash Flow Summary Plant Improvements ($26,642) ($2,800) Digby Cash Flows from Financing Activities: Dividends Paid Sales of Common Stock ($6,015) ($4,347) 20,000 Purchase of Common Stock so Cash from long term debt Retirement of long term debt $15,725 ($5,900) sol 10,000 Change in current debt (net) $9.693 $1,631) $6,026 0 Net cash from financing activities Net change in cash position $13.502 $32,612 $2,22 $26,156 -10.000 Closing cash position $6.456 $12,003 -20,000 Operations Finance Chg. Cash Operations Investment ) Finance O Chg. Cash Annual Report Page 1 https://ww2.capsim.com/cgi-bin/displayReport.cfm?Report=AnnReport 11/1210/8/2020 Report Page Top Annual Report C59559 Round: 0 Digby Dec. 31, 2019 2019 Income Statement (Product Name:) Daze Dell Duck Do Na Na 2019 Common Total Sales $34,633 $41,524 $21,680 $21,129 So $118,965 100.0% Variable Costs: Direct Labor $4,880 $4,325 $24,233 0.4 7 Direct Material $12, 115 $10,627 $18,116 $4,400 $9.173 58 421 Inventory Carr $26 $348 Total Variable $17.022 $28, 769 $13,950 13,094 8868 8868 0 70% $72,835 61 2% Contribution Margin $17,61 $12,755 $7,730 $8,035 SO 8888 SO 8 8868 $46, 130 38.8% Period Costs Depreciation $2,800 $1,387 $8,293 SG&A: R&D $1,000 $2,607 $928 $1,500 $988 $857 $3,772 $950 $950 $950 $3,800 3 .2% Promotions $950 Sales $1,000 $1,000 $600 $3,900 $322 $1,300 3.3% Admin $6.264 8 10 Total Period $6,10 $4.360 $4.807 886888 888888 868688 $21.532 Net Margin $11,34 $6.654 $3,370 $3,227 $0 $24,598 20.7 Definitions: Sales: Unit sales times list price. Direct Labor: Labor costs incurred to produce the product that was sold. inventory Carry Cost: the cost to carry unsold goo any unsold goods in inventory. Depreciation: Calculated on straight-line 15-year Other $786 eciation of plant value. R&D Costs: R&D department expenditures for each product. Admin: Administration BUTT Short Term Interest $23,872 20.09% s estimated at 1.5% of sales. Promotions: The promotion budget for each product. Sales: The sales force $2,70 each product. Other: such as Fees, Write Offs, and TQM. The fees Long Term Interest $5,606 4.3% er: Charges not included in other categories su include money paid to investment bankers and brokerage firms to issue new stocks or bonds plus consulting fees Taxes 4:7% instructor might assess. Write-offs include the clude the loss you might experience when you sell capacity or liquidate inventory as Profit Sharing Net Profit $10,203 0.2% 8.6 % the result of eliminating a production line. If the amount appears as a negative amount, then you actually made money on ation of capacity or inventory. EBIT: Earnings Before Interest and Taxes. Short Term Interest: Interest expense based on last year's current debt, including short term debt, long term notes that have become due, and emergency Variable Margins loans. Long Term Interest: Interest paid on outstanding b itstanding bonds. Taxes: Income tax based upon a 35% tax rate. Profit Sharing: Profits shared with employees under the labor contract. Net Profit: EBIT minus interest, taxes, and profit 2008 Digby sharing. 50.0% 40.0% 30.0% 20.0% 10.0% 0.0% Daze Duc 82222 Profit History Market Share History $10,000 25% 58,000 20% $6,000 15% $4,000 10% $2,000 5% SO 0% 2015 2016 2017 2018 2019 2015 2016 2017 2018 2019 ROE History Asset Turnover History 20% 15% 1.0 10% 10.5 5% 0% 0.0 2015 2016 2017 2018 2019 2015 2016 2017 1018 2019 ROS History ROA History 10% 10.0% 8% 8.0% 6% 5.0% 4% 4.0% 2% 2.0% 0% 0.0% 2015 2016 2017 2018 2019 2015 2016 2017 2018 2019 Annual Report Page 2 https://ww2.capsim.com/cgi-bin/displayReport.cfm?Report=AnnReport 12/12