Answered step by step
Verified Expert Solution
Link Copied!

Question

1 Approved Answer

HOW TO DO THIS? The followiny mond opp Selected comparative financial statements of Korbin Company follow. KORBIN COMPANY Comparative Income Statements For Years Ended December
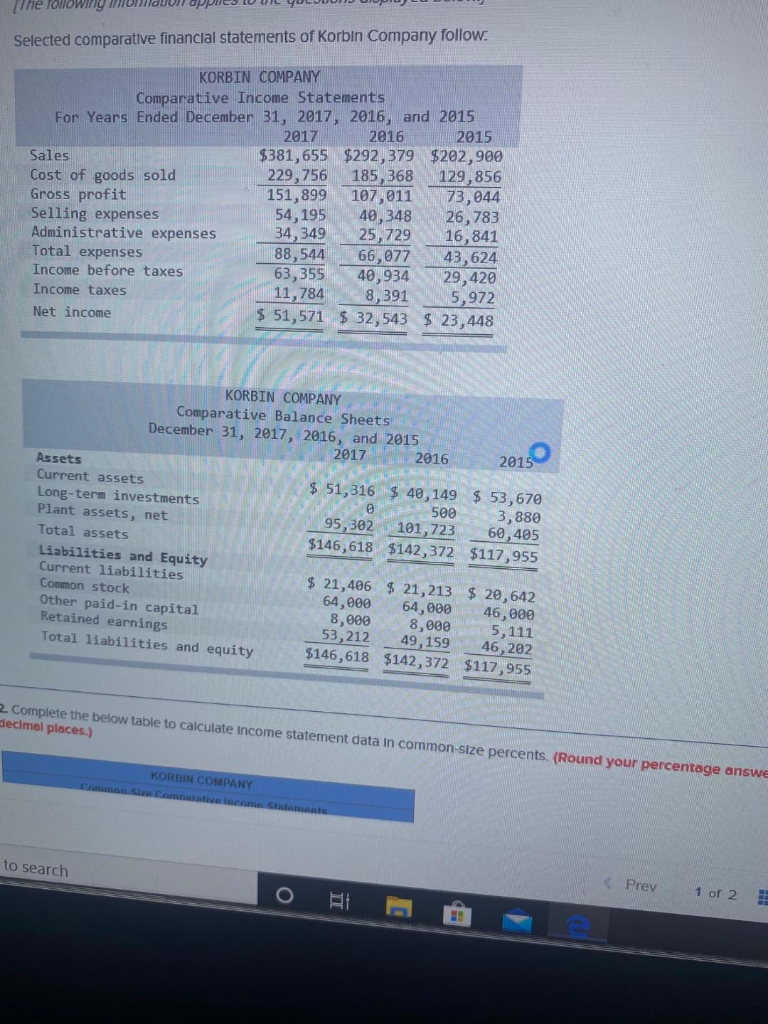
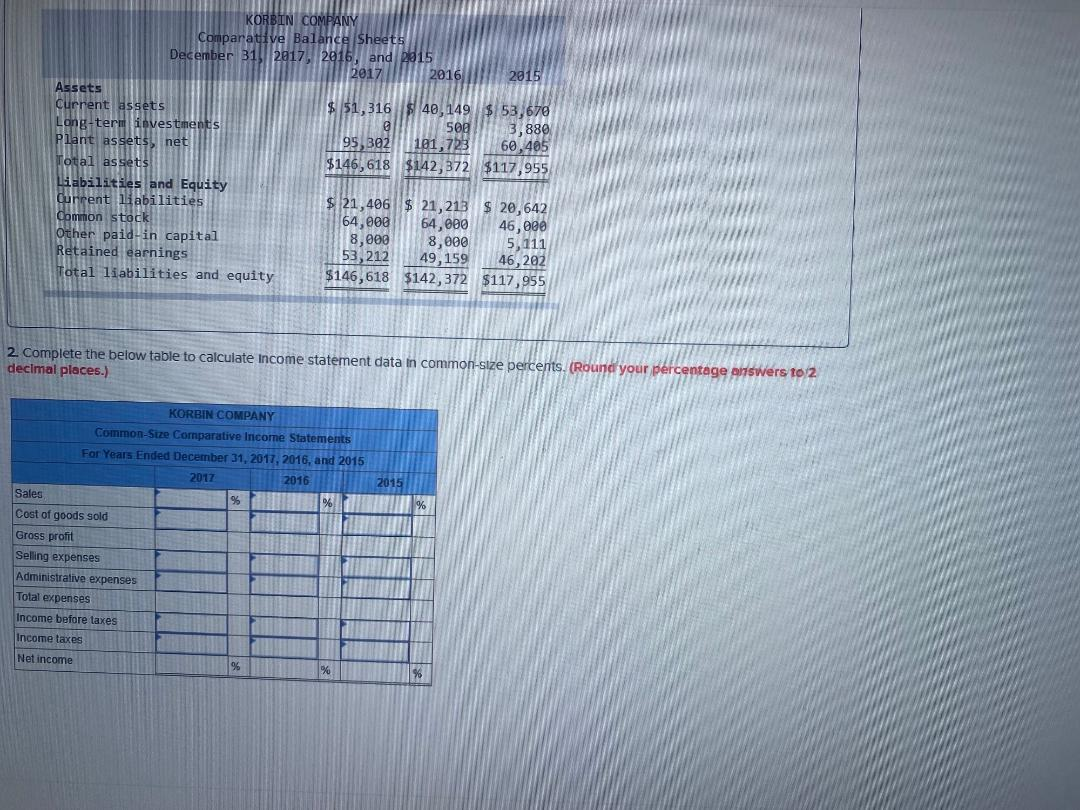
image text in transcribedimage text in transcribedHOW TO DO THIS?

The followiny mond opp Selected comparative financial statements of Korbin Company follow. KORBIN COMPANY Comparative Income Statements For Years Ended December 31, 2017, 2016, and 2015 2017 2016 2015 Sales $381,655 $292,379 $202,900 Cost of goods sold 229,756 185,368 129,856 Gross profit 151,899 107, 011 73,044 Selling expenses 54, 195 40,348 26,783 Administrative expenses 34,349 25,729 16,841 Total expenses 88,544 66,077 43,624 Income before taxes 63,355 40,934 29,420 Income taxes 11,784 8,391 5,972 Net income $ 51,571 $ 32,543 $ 23,448 KORBIN COMPANY Comparative Balance Sheets December 31, 2017, 2016, and 2015 2017 2016 2015 Assets Current assets $ 51,316 $ 40,149 $ 53,670 Long-term investments 500 3,880 Plant assets, net 95,302 101,723 60,405 Total assets $146,618 $142,372 $117,955 Liabilities and Equity Current liabilities $ 21,406 $ 21,213 $ 20,642 Common stock 64,000 64,000 46,000 Other paid-in capital 8,000 8,000 Retained earnings 5,111 53,212 49, 159 46,202 Total liabilities and equity $146,618 $142,372 $117,955 2. Complete the below table to calculate income statement data in common-size percents. (Round your percentage answe secimal places.) KORBIN COMPANY to search Prev O 1 of 2 BI KORBIN COMPANY Comparative Balance Sheets December 312017, 2016, and 2015 2017 2016 2015 Assets Current assets $ 51,316 $40,149 $ 53,670 Long-term investments 500 3,880 Plant assets neti 95,302 101,723 60,405 Total assets $146,618 $142,372 $117,955 Liabilities and Equity current liabilities $ 21,406 $ 21,213 $ 20,642 Common stock 64,000 64,000 46,000 Other paid-in capital 8,000 8,000 5,111 Retained earnings 53,212 49, 159 46,202 Total liabilities and equity $146,618 $142,372 $117,955 2. Complete the below table to calculate income statement data in common-size percents. (Round your percentage answers to 2 decimal places.) 2015 KORBIN COMPANY Common-Size Comparative Income Statements For Years Ended December 31, 2017, 2016, and 2015 2017 2016 Sales Cost of goods sold Gross profit Selling expenses Administrative expenses Total expenses Income before taxes Income taxes Net income % %

Step by Step Solution

There are 3 Steps involved in it

Step: 1

blur-text-image

Get Instant Access to Expert-Tailored Solutions

See step-by-step solutions with expert insights and AI powered tools for academic success

Step: 2

blur-text-image_2

Step: 3

blur-text-image_3

Ace Your Homework with AI

Get the answers you need in no time with our AI-driven, step-by-step assistance

Get Started

Recommended Textbook for

Knowledge Audit Complete Self Assessment Guide Practical Tools For Self Assesment

Authors: Gerardus Blokdyk

1st Edition

0655199837, 978-0655199830

More Books

Students also viewed these Accounting questions