Answered step by step
Verified Expert Solution
Question
1 Approved Answer
How to find Common Size Statement of Cash Flows (% of Sales) For the year ended Dec. 31, 2020 on EXCEL I've been trying to
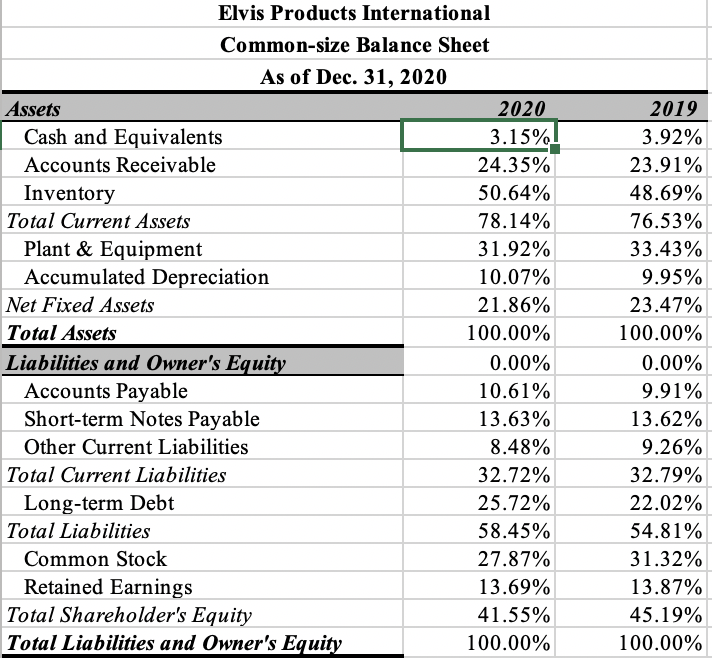
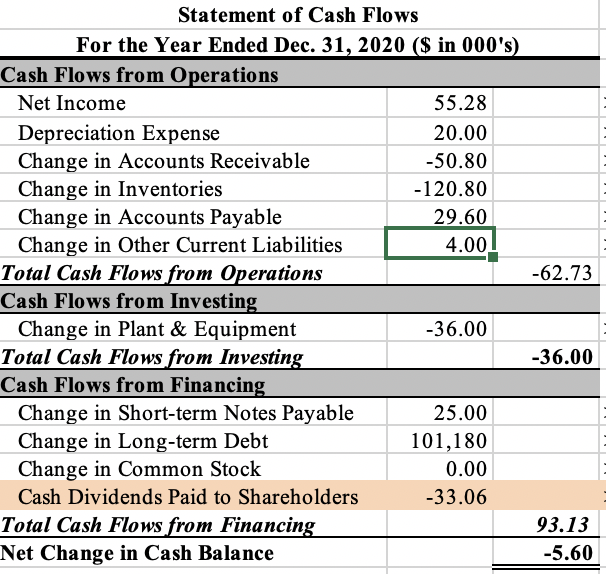
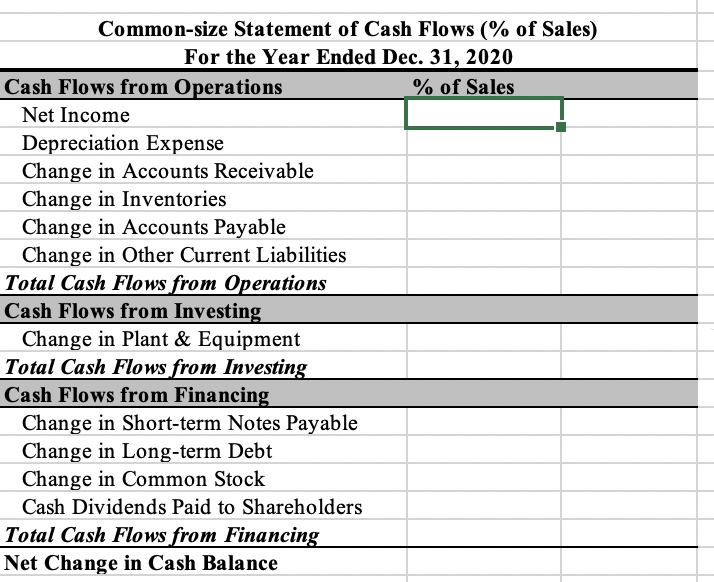
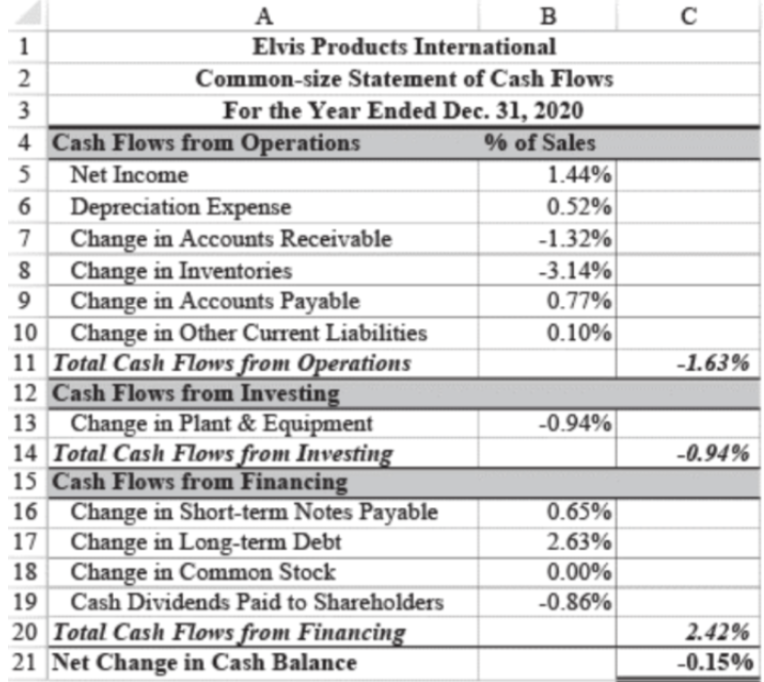
How to find Common Size Statement of Cash Flows (% of Sales) For the year ended Dec. 31, 2020 on EXCEL
I've been trying to play around with the numbers however I am very confused on what I am doing wrong. The professor gave us the answer sheet but not how to do it. I'm curious as to what I'm doing wrong, and what formulas in Excel I should be using.
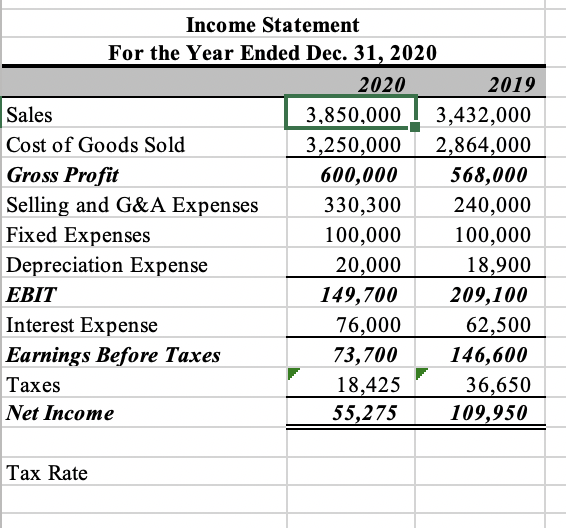
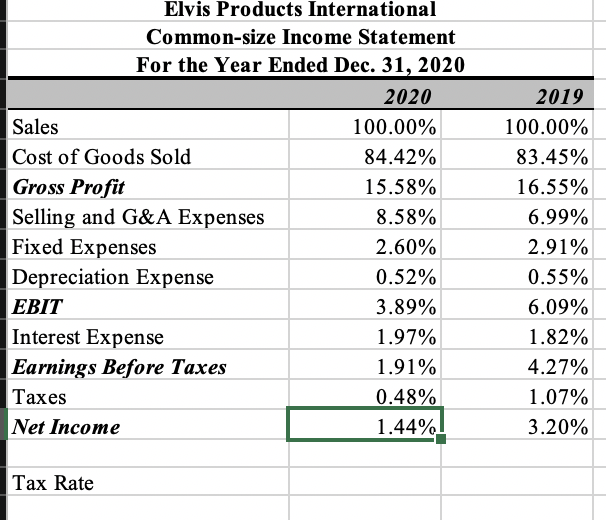
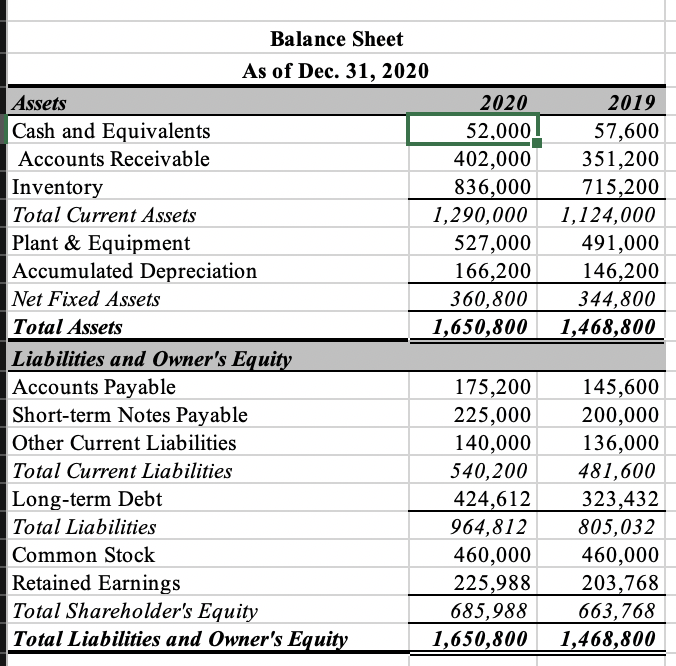
Income Statement For the Year Ended Dec. 31, 2020 2020 2019 Sales 3,850,000 3,432,000 Cost of Goods Sold 3,250,000 2,864,000 Gross Profit 600,000 568,000 Selling and G&A Expenses 330,300 240,000 Fixed Expenses 100,000 100,000 Depreciation Expense 20,000 18,900 EBIT 149,700 209,100 Interest Expense 76,000 62,500 Earnings Before Taxes 73,700 146,600 Taxes 18,425 36,650 Net Income 55,275 109,950 Tax Rate Elvis Products International Common-size Income Statement For the Year Ended Dec. 31, 2020 2020 Sales 100.00% Cost of Goods Sold 84.42% Gross Profit 15.58% Selling and G&A Expenses 8.58% Fixed Expenses 2.60% Depreciation Expense 0.52% EBIT 3.89% Interest Expense 1.97% Earnings Before Taxes 1.91% Taxes 0.48% Net Income 1.44% 2019 100.00% 83.45% 16.55% 6.99% 2.91% 0.55% 6.09% 1.82% 4.27% 1.07% 3.20% Tax Rate 2019 57,600 351,200 715,200 1,124,000 491,000 146,200 344,800 1,468,800 Balance Sheet As of Dec. 31, 2020 Assets 2020 Cash and Equivalents 52,000 Accounts Receivable 402,000 Inventory 836,000 Total Current Assets 1,290,000 Plant & Equipment 527,000 Accumulated Depreciation 166,200 Net Fixed Assets 360,800 Total Assets 1,650,800 Liabilities and Owner's Equity Accounts Payable 175,200 Short-term Notes Payable 225,000 Other Current Liabilities 140,000 Total Current Liabilities 540,200 Long-term Debt 424,612 Total Liabilities 964,812 Common Stock 460,000 Retained Earnings 225,988 Total Shareholder's Equity 685,988 Total Liabilities and Owner's Equity 1,650,800 145,600 200,000 136,000 481,600 323,432 805,032 460,000 203,768 663,768 1,468,800 Elvis Products International Common-size Balance Sheet As of Dec. 31, 2020 Assets 2020 Cash and Equivalents 3.15% Accounts Receivable 24.35% Inventory 50.64% Total Current Assets 78.14% Plant & Equipment 31.92% Accumulated Depreciation 10.07% Net Fixed Assets 21.86% Total Assets 100.00% Liabilities and Owner's Equity 0.00% Accounts Payable 10.61% Short-term Notes Payable 13.63% Other Current Liabilities 8.48% Total Current Liabilities 32.72% Long-term Debt 25.72% Total Liabilities 58.45% Common Stock 27.87% Retained Earnings 13.69% Total Shareholder's Equity 41.55% Total Liabilities and Owner's Equity 100.00% 2019 3.92% 23.91% 48.69% 76.53% 33.43% 9.95% 23.47% 100.00% 0.00% 9.91% 13.62% 9.26% 32.79% 22.02% 54.81% 31.32% 13.87% 45.19% 100.00% Statement of Cash Flows For the Year Ended Dec. 31, 2020 ($ in 000's) Cash Flows from Operations Net Income 55.28 Depreciation Expense 20.00 Change in Accounts Receivable -50.80 Change in Inventories -120.80 Change in Accounts Payable 29.60 Change in Other Current Liabilities 4.00 Total Cash Flows from Operations -62.73 Cash Flows from Investing Change in Plant & Equipment -36.00 Total Cash Flows from Investing -36.00 Cash Flows from Financing Change in Short-term Notes Payable 25.00 Change in Long-term Debt 101,180 Change in Common Stock 0.00 Cash Dividends Paid to Shareholders -33.06 Total Cash Flows from Financing 93.13 Net Change in Cash Balance -5.60 Common-size Statement of Cash Flows (% of Sales) For the Year Ended Dec. 31, 2020 Cash Flows from Operations % of Sales Net Income Depreciation Expense Change in Accounts Receivable Change in Inventories Change in Accounts Payable Change in Other Current Liabilities Total Cash Flows from Operations Cash Flows from Investing Change in Plant & Equipment Total Cash Flows from Investing Cash Flows from Financing Change in Short-term Notes Payable Change in Long-term Debt Change in Common Stock Cash Dividends Paid to Shareholders Total Cash Flows from Financing Net Change in Cash Balance A B 1 Elvis Products International 2. Common-size Statement of Cash Flows 3 For the Year Ended Dec. 31, 2020 4 Cash Flows from Operations % of Sales 5 Net Income 1.44% 6 Depreciation Expense 0.52% 7 Change in Accounts Receivable -1.32% 8 Change in Inventories -3.14% 9 Change in Accounts Payable 0.77% 10 Change in Other Current Liabilities 0.10% 11 Total Cash Flows from Operations 12 Cash Flows from Investing 13 Change in Plant & Equipment -0.94% 14 Total Cash Flows from Investing 15 Cash Flows from Financing 16 Change in Short-term Notes Payable 0.65% 17 Change in Long-term Debt 2.63% 18 Change in Common Stock 0.00% 19 Cash Dividends Paid to Shareholders -0.86% 20 Total Cash Flows from Financing 21 Net Change in Cash Balance -1.63% -0.94% 2.42% -0.15%Step by Step Solution
There are 3 Steps involved in it
Step: 1

Get Instant Access to Expert-Tailored Solutions
See step-by-step solutions with expert insights and AI powered tools for academic success
Step: 2

Step: 3

Ace Your Homework with AI
Get the answers you need in no time with our AI-driven, step-by-step assistance
Get Started


