Answered step by step
Verified Expert Solution
Link Copied!

Question

1 Approved Answer

How to plot this equation of stock price by Matlab S(t + h) = S(t) + us at +oStvat Where = norm(0,1) and S(t)Hat,o any
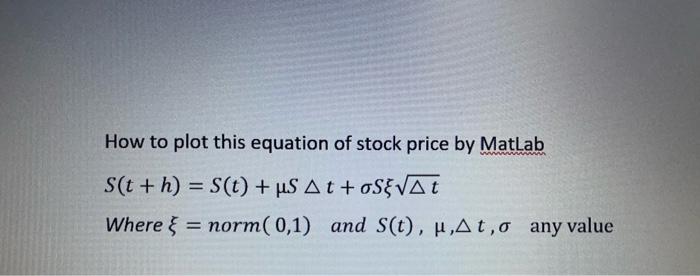
image text in transcribed
How to plot this equation of stock price by Matlab S(t + h) = S(t) + us at +oStvat Where = norm(0,1) and S(t)Hat,o any value

Step by Step Solution

There are 3 Steps involved in it

Step: 1

blur-text-image

Get Instant Access to Expert-Tailored Solutions

See step-by-step solutions with expert insights and AI powered tools for academic success

Step: 2

blur-text-image

Step: 3

blur-text-image

Ace Your Homework with AI

Get the answers you need in no time with our AI-driven, step-by-step assistance

Get Started

Recommended Textbook for

Database Design Application Development And Administration

Authors: Michael V. Mannino

3rd Edition

0071107010, 978-0071107013

More Books

Students also viewed these Databases questions

Question

What is brainstorming?

Answered: 1 week ago

Question

Briefly explain the various types of leadership ?

Answered: 1 week ago

Question

Explain the need for and importance of co-ordination?

Answered: 1 week ago

Question

Explain the contribution of Peter F. Drucker to Management .

Answered: 1 week ago

Question

What is meant by organisational theory ?

Answered: 1 week ago

Question

What is the basis for Security Concerns in Cloud Computing?

Answered: 1 week ago

Question

Describe the three main Cloud Computing Environments.

Answered: 1 week ago