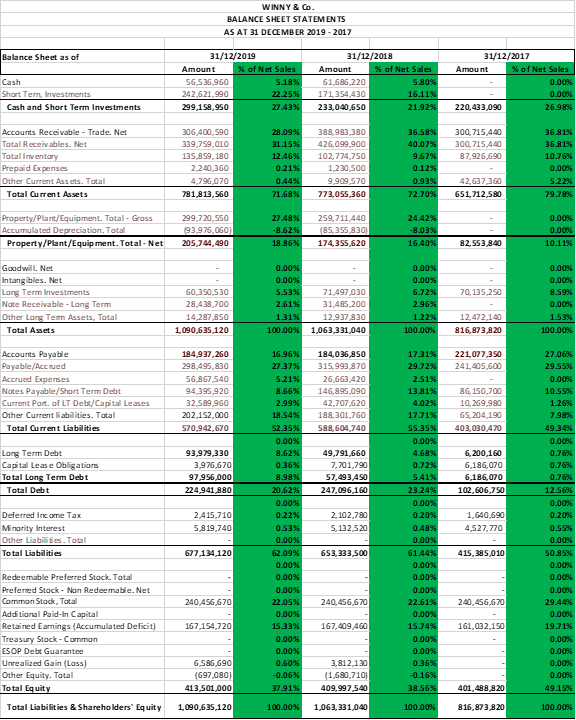
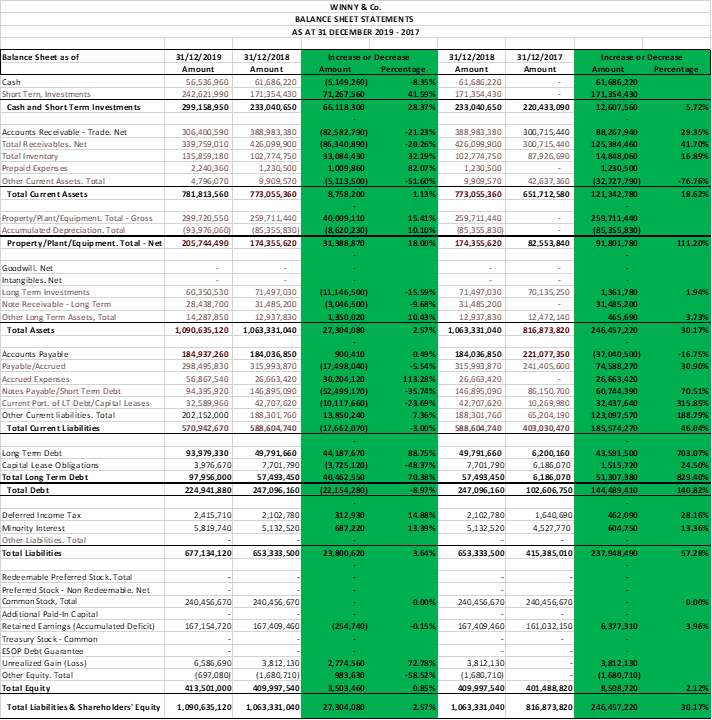
How to write the findings/conclusions for Horizontal Analysis & Vertical Analysis based on below Balance Sheet Statement? Image 1- Vertical Analysis, Image 2- Horizontal Analysis
Image 1:

Image 2:

WINNY & Co. BALANCE SHEET STATEMENTS AS AT 31 DECEMBER 2019-2017 Balance Sheet as of Cash Short Tern, Investments Cash and Short Term Investments 31/12/2019 Amount % of Net Sales 56,536,960 5.18% 242,621,990 22 25% 299,158,950 27.43% 31/12/2018 Amount % of Net Sales 61,686 220 5.80% 171,354,430 16.11% 233,040,650 21.92% 31/12/2017 Amount % of Net Sales 0.00% 0.00% 220,433,090 26.9886 300,715,440 300,715,440 87,926,690 Accounts Receivable - Trade. Net Total Receivables. Net Total Inventory Prepaid Expenses Other Current Assets. Total Total Current Assets 306,400,590 339,759,010 135,859,180 2,240,360 4,796,070 781,813,560 28.09% 31.15% 12.46% 0.21% 0.44% 71.68% 388,983,380 426,099,900 102,774,750 1,230,500 9.909 570 773,055 360 36.58% 40.07% 9.67% 0.12% 0.93% 72.70% 36.81% 36.81% 10.76% 0.00% 42,637,360 651,712 580 5.22% 79.79% Property/Plant/Equipment. Total - Gross Accumulated Depreciation. Total Property/Plant/Equipment. Total-Net 299,720.550 193,976,060) 205,744,490 27.48% -8.62% 259,711,440 (85,355 830 24.42% -8.039 16.40% 0.00% 0.00% 18.86% 174,355,620 82,553,840 10.11% Goodwill. Net Intangibles. Net Long Term Investments Note Receivable - Long Term Other Long Tem Assets, Total Total Assets 0.00% 0.00% 6.72% 2.96% 70,135,250 0.00% 0.00% 5.53% 2.61% 1.31% 100.00% 0.00% 0.00% 8.59% 0.00% 60 350 530 28,438,700 14,287,850 1,090,635,120 71.497.030 31,485,200 12.937 830 1,063,331,040 1.22% 100.00% 12,472,140 816,873,820 1.5396 100.00% 221,077,350 241, 405,600 Accounts Payable Payable/Accrued Accrued Expenses Notes Payable/Short Term Debt Current Port of LT Debit/Capital Leases Other Current liabilities. Total Total Current Liabilities 184,937,260 298,495,830 56.867.540 94,395,920 32.589,960 202,152,000 570,942,670 16.96% 27.37% 5.21% 8.66% 2.99% 18.54% 52.35% 0.00% 8.62% 0.36% 8.98% 20.62% 0.00% 184,036,850 315,993,870 26,663,420 146,895,090 42,707,620 188,301,760 588,604,740 86,150,700 10,269 990 65,204,190 403,030,470 Long Term Debt Capital Lease Obligations Total Long Term Debt Total Debt 93,979,330 3,976,670 97,956,000 224,941,880 49,791,660 7,701,790 57,493,450 247,096,160 6,200,160 6,186,070 6,186,070 102,606,750 2,415,710 5,819,740 2,102,790 5,132,520 Deferred Income Tax Minority Interest Other Liabilities. Total Total Liabilities 1,640,690 4,527,770 17.31% 29.72% 2.51% 13.81% 4.02% 17.71% 55.35% 0.00% 4.68% 0.72% 5.41% 23.24% 0.00% 0.20% 0.48% 0.00% 61.44% 0.00% 0.00% 0.00% 22.61% 0.00% 15.74% 0.00% 0.00% 0.36% -0.16% 38.56% 27.06% 29.55% 0.009 10.55% 1.26% 7.99% 49.34% 0.00% 0.7696 0.76% 0.769 12.56% 0.00% 0.20% 0.55% 0.00% 50.85% 0.00% 0.00% 0.00% 29.44% 0.00% 19.71% 0.00% 0.00% 0.00% 0.00% 677,134,120 0.22% 0.53% 0.00% 62.09% 0.00% 0.00% 0.00% 22.05% 0.00% 653,333,500 415,385,010 240,456,670 240, 456,670 240,456,670 167,154,720 167,409,460 161,032,150 Redeemable Preferred Stock. Total Preferred Stock - Non Redeemable.Net Common Stack, Total Additional Paid-In Capital Retained Earnings (Accumulated Deficit] Treasury Stock - Common ESOP Debt Guarantee Unrealized Gain (Loss) Other Equity. Total Total Equity 15.33% 0.00% 0.00% 0.60% -0.06% 37.91% 6,586,690 (697,080) 413,501,000 3,812,130 (1,690,710) 409,997,540 401,488 8.20 49.15% Total Liabilities & Shareholders' Equity 1,090,635,120 100.00% 1,063,331,040 100.00% 816,873,820 100.00% WINNY & Co. BALANCE SHEET STATEMENTS AS AT 31 DECEMBER 2019-2017 Balance Sheet as of 31/12/2017 Amount Cash Short Tern, Investments Cash and Short Term Investments 31/12/2019 Amount 56,536,960 242,621 990 299,158,950 31/12/2018 Amount 61,686,220 171 354,430 233,040,650 Increase or Decrease Amount Percentage (5,149,260) -8.35% 71,267,560 41.59% 66,118,300 28.37% 31/12/2018 Amount 61,686 220 171,354,430 233,040,650 Increase or Decrease Amount Percentage 61,686 220 171,354,430 12,607,560 5.7256 220,433,090 300,715, 440 300,715, 440 87,926,690 Accounts Receivable - Trade. Net Total Receivables. Net Total Inventory Prepaid Expenses Other Current Assets. Total Total Current Assets 29.35% 41.70% 16.89% 306,400,590 339,759,010 135,859,180 2,240,360 4,796,070 781,813,560 398,983,380 426,099,900 102,774,750 1,230,500 9,909,570 773,055,360 -21.23% -20.26% 32.19% 82.07% -51.60% (82,582,790) (96,340,890) 33,084,430 1,009,860 (5, 113,500) 8.758 200 388,983,380 426,099,900 102,774,750 1,230,500 9,909 570 773,055,360 88,267,940 125,384,460 14,848,060 1,230,500 (32.727,790) 121,342,780 42,637,360 651,712,580 -76.76% 18.629 1.13% Property/Plant/Equipment. Total - Gross Accumulated Depreciation. Total Property/Plant/Equipment. Total-Net 299,720,550 (93,976,060) 205,744.490 259,711,440 (85,355,830) 174,355,620 40,009,110 (8,620,230) 31,388,870 15.41% 10.10% 18.00% 259,711 440 185,355 830 174,355,620 259,711 440 (85,355,830) 91,801,780 82 553,840 111 20% 70,135.250 1.94% Goodwill. Net Intangibles.Net Long Tem Investments Note Receivable - Long Term Other Long Term Assets, Total Total Assets 60,350,530 28,438,700 14,287 850 1,090,635,120 71,497,030 31,485,200 12,937,830 1,063,331,040 (11,146,500) (3,046,500) 1,350,020 27,304,080 -15.59% -9.68% 10.43% 2.57% 71,497.030 31,485,200 12.937 830 1,063,331,040 1,361,790 31,485 200 465,690 246,457,220 12,472,140 816,873,820 3.73% 30.17% 221,077,350 241,405,600 -16.75% 30.90% Accounts Payable Payable/Accrued Accrued Expenses Notes Payable/Short Tem Debt Current Port of LT Debit/Capital Leases Other Current liabilities. Total Total Current Liabilities 184,937,260 298,495,830 56,867,540 94 395 920 32.589,960 202,152,000 570,942,670 184,036,850 315,993,870 26,663,420 146 895.090 42,707,620 188,301,760 588,604,740 900,410 (17.498,040) 30, 204,120 (52,499,170) (10,117,660) 13,850 240 (17,662,070) 0.49% -5.54% 113.28% -35.74% -23.69% 7.36% -3.00% 184,036,850 315,993,870 26,663,420 146,895,090 42,707,620 188,301,760 588,604,740 86,150,700 10,269,980 65,204,190 403,030,470 (37,040,500) 74,588,270 26,663,420 60,744,390 32,437,640 123,097,570 185,574 270 70.51% 315.85% 188.79% 46.04% Long Tem Debt Capital Lease Obligations Total Long Term Debt Total Debt 93,979,330 3,976,670 97,956,000 224,941,880 49,791,660 7,701,790 57493,450 247,096,160 44,187,670 (3.725,120) 40,462 550 (22,154 280) 88.75% -48.37% 70.38% -8.97% 49,791,660 7,701,790 57,493,450 247,096,160 6,200,160 6,186,070 6,186,070 102,606,750 43,591,500 1,515,720 51,307,380 144,489,410 703.07% 24.50% 829.40% 140.8296 28 16% 2,415,710 5,819,740 2,102,780 5,132,520 312,930 687,220 14.88% 13.39% 2,102,780 5,132,520 1,640, 690 4,527,770 462,090 604,750 13.36% Deferred Income Tax Minority Interest Other Liabilities. Total Total Liabilities 677,134,120 653,333,500 23,800,620 3.64% 653,333,500 415,385,010 237,948,490 57.28% 240,456,670 240,456,670 0.00% 240,456,670 240,456,670 0.008 167,154,720 167,409, 460 (254,740) -0.15% 167,409,460 161,032,150 6,377,310 3.96% Redeemable Preferred Stock. Total Preferred Stock - Non Redeemable. Net Common Stack, Total Additional Paid-in Capital Retained Earnings (Accumulated Deficit) Treasury Stock - Common ESOP Debt Guarantee Unrealized Gain (Loss) Other Equity. Total Total Equity Total Liabilities & Shareholders' Equity 6,586,690 (697,080) 413.501,000 3,812,130 (1,680,710) 409,997,540 2,774,560 983,630 3,503,460 72.78% -58.52% 0.85% 3,812,130 (1,680,7101 409,997 540 3,812,130 (1,680,710) 8,508,720 401 488,820 2.1234 1,090,635,120 1,063,331,040 27,304,080 2.57% 1,063,331,040 816,873,820 246, 457,220 30.17%