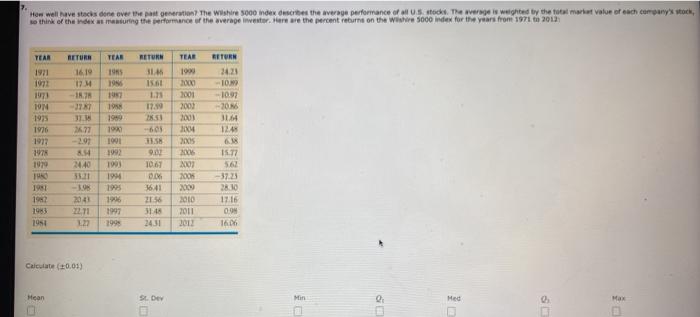
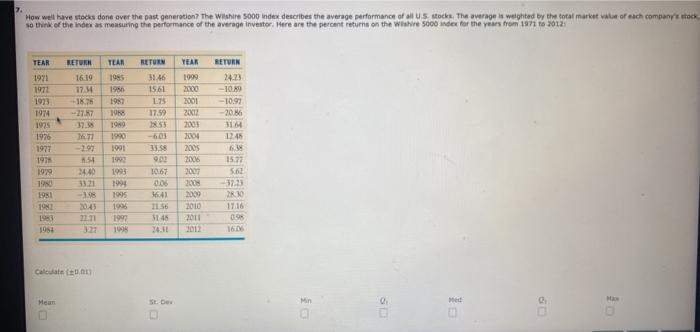
How well ave stocks done over the past generation The Wilshire 5000 index describes the average performance of the average is weighted by the total market value of each company's stock, so think of the ring the performance of the average weiter. Here are the percent return on the W 5000 index for the years from 1971 to 2013 TEAR TEAR RETURN TEAR WIE 1951 1971 1972 1973 19N 1975 1976 1972 1978 1979 RETURN 1619 17 M 18. -27 11.15 2677 RETURN 2021 - 10 -10.97 - 2016 3164 124 12 28.53 1994 2000 2001 2000 2001 2004 2005 200 2002 19 19 10 1989 1941 1991 1992 1903 1994 1995 1996 1997 1998 18.SH 2440 2009 1981 192 1983 1954 - 20:41 22.11 1067 004 16:41 21:56 348 24.31 2000 2010 2011 2012 15.72 56 - 37.23 28.10 17.16 00 1606 Calculate (0.05) Mean Su Dev Min 0 Max 2. How well have stocks done over the past generation? The Wilshire 500 index describes the average performance of all us stocksThe average is weighted by the total market value of each company's stock so think of the index as measuring the performance of the average Investor. Here are the percent returns on the Wishire 5000 index for the years from 1971 to 2012 TLAR RETURN YEAR TEAR 1971 1977 1913 1974 1975 1976 RETURN 16.19 17.14 -16.75 27.7 1985 1986 1982 1958 3146 1561 175 RETURN 24.23 -1019 -10.92 -20.86 17.59 1980 144 1990 1901 1999 200 2001 2017 2003 2004 2005 2006 2007 2008 2009 2010 MT 297 15 24.40 33.21 - 204 12. 12 1971 1979 1980 13.55 902 10.67 006 1993 1994 1995 1996 1990 109 12.45 6 15:27 5.62 37.33 BRO 17.16 0.95 160 1981 1983 1954 ILSE 5145 24.11 Calc. Mean Min 0 Med How well ave stocks done over the past generation The Wilshire 5000 index describes the average performance of the average is weighted by the total market value of each company's stock, so think of the ring the performance of the average weiter. Here are the percent return on the W 5000 index for the years from 1971 to 2013 TEAR TEAR RETURN TEAR WIE 1951 1971 1972 1973 19N 1975 1976 1972 1978 1979 RETURN 1619 17 M 18. -27 11.15 2677 RETURN 2021 - 10 -10.97 - 2016 3164 124 12 28.53 1994 2000 2001 2000 2001 2004 2005 200 2002 19 19 10 1989 1941 1991 1992 1903 1994 1995 1996 1997 1998 18.SH 2440 2009 1981 192 1983 1954 - 20:41 22.11 1067 004 16:41 21:56 348 24.31 2000 2010 2011 2012 15.72 56 - 37.23 28.10 17.16 00 1606 Calculate (0.05) Mean Su Dev Min 0 Max 2. How well have stocks done over the past generation? The Wilshire 500 index describes the average performance of all us stocksThe average is weighted by the total market value of each company's stock so think of the index as measuring the performance of the average Investor. Here are the percent returns on the Wishire 5000 index for the years from 1971 to 2012 TLAR RETURN YEAR TEAR 1971 1977 1913 1974 1975 1976 RETURN 16.19 17.14 -16.75 27.7 1985 1986 1982 1958 3146 1561 175 RETURN 24.23 -1019 -10.92 -20.86 17.59 1980 144 1990 1901 1999 200 2001 2017 2003 2004 2005 2006 2007 2008 2009 2010 MT 297 15 24.40 33.21 - 204 12. 12 1971 1979 1980 13.55 902 10.67 006 1993 1994 1995 1996 1990 109 12.45 6 15:27 5.62 37.33 BRO 17.16 0.95 160 1981 1983 1954 ILSE 5145 24.11 Calc. Mean Min 0 Med


