Answered step by step
Verified Expert Solution
Question
1 Approved Answer
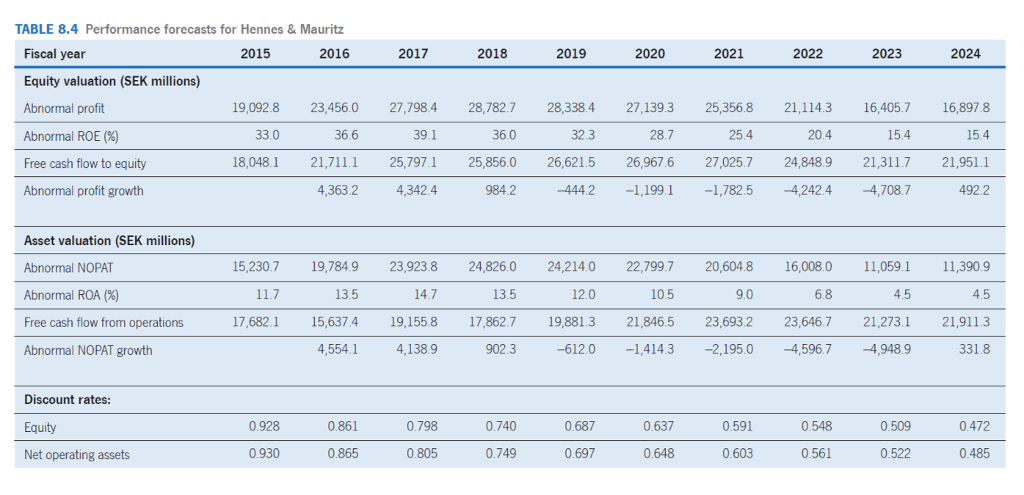
How will the abnormal profit calculations in table 8.4 change if the cost of equity assumption is changed to 10% TABLE 8.4 Performance forecasts for
How will the abnormal profit calculations in table 8.4 change if the cost of equity assumption is changed to 10%

TABLE 8.4 Performance forecasts for Hennes & Mauritz Fiscal year 2015 2016 2017 2018 2019 2020 2021 2022 2023 2024 Equity valuation (SEK millions) Abnormal profit 27,139.3 25,356.8 21,114.3 16,405.7 16,897.8 Abnormal ROE (%) 19,092.8 33.0 18,048.1 28.7 25.4 20.4 15.4 23,456.0 36.6 21,711.1 4,363.2 27,798.4 39.1 25,797.1 4,342.4 28,782.7 36.0 25,856.0 984.2 28,338.4 32.3 26,621.5 -444.2 Free cash flow to equity 26,967.6 -1,199.1 27,025.7 -1,782.5 24,848.9 -4,242.4 15.4 21,3117 -4,708.7 21,951.1 492.2 Abnormal profit growth Asset valuation (SEK millions) 24,826.0 24,214.0 22,799.7 20,604.8 16,008,0 11,059,1 11,390.9 Abnormal NOPAT Abnormal ROA (%) 15,230.7 11.7 19,784.9 13.5 23,923.8 14.7 13.5 12.0 10.5 9.0 6.8 4.5 4.5 Free cash flow from operations 17,682.1 15,637.4 19,155.8 17,862.7 19,881.3 21,846.5 23,693.2 23,646.7 21,273.1 21,911.3 Abnormal NOPAT growth 4,554. 1 4 ,138.9 902.3 -612.0 -1,414.3 -2,195.0 -4,596.7 -4,948.9 331.8 Discount rates: Equity 0.928 0.930 0.861 0.865 0.798 0.805 0.740 0.749 0.687 0.697 0.637 0.648 0.591 0.603 0.548 0.561 0.509 0.522 0.472 0.485 Net operating assets TABLE 8.4 Performance forecasts for Hennes & Mauritz Fiscal year 2015 2016 2017 2018 2019 2020 2021 2022 2023 2024 Equity valuation (SEK millions) Abnormal profit 27,139.3 25,356.8 21,114.3 16,405.7 16,897.8 Abnormal ROE (%) 19,092.8 33.0 18,048.1 28.7 25.4 20.4 15.4 23,456.0 36.6 21,711.1 4,363.2 27,798.4 39.1 25,797.1 4,342.4 28,782.7 36.0 25,856.0 984.2 28,338.4 32.3 26,621.5 -444.2 Free cash flow to equity 26,967.6 -1,199.1 27,025.7 -1,782.5 24,848.9 -4,242.4 15.4 21,3117 -4,708.7 21,951.1 492.2 Abnormal profit growth Asset valuation (SEK millions) 24,826.0 24,214.0 22,799.7 20,604.8 16,008,0 11,059,1 11,390.9 Abnormal NOPAT Abnormal ROA (%) 15,230.7 11.7 19,784.9 13.5 23,923.8 14.7 13.5 12.0 10.5 9.0 6.8 4.5 4.5 Free cash flow from operations 17,682.1 15,637.4 19,155.8 17,862.7 19,881.3 21,846.5 23,693.2 23,646.7 21,273.1 21,911.3 Abnormal NOPAT growth 4,554. 1 4 ,138.9 902.3 -612.0 -1,414.3 -2,195.0 -4,596.7 -4,948.9 331.8 Discount rates: Equity 0.928 0.930 0.861 0.865 0.798 0.805 0.740 0.749 0.687 0.697 0.637 0.648 0.591 0.603 0.548 0.561 0.509 0.522 0.472 0.485 Net operating assets
Step by Step Solution
There are 3 Steps involved in it
Step: 1

Get Instant Access to Expert-Tailored Solutions
See step-by-step solutions with expert insights and AI powered tools for academic success
Step: 2

Step: 3

Ace Your Homework with AI
Get the answers you need in no time with our AI-driven, step-by-step assistance
Get Started


