

Answered step by step
Verified Expert Solution
Question
1 Approved Answer
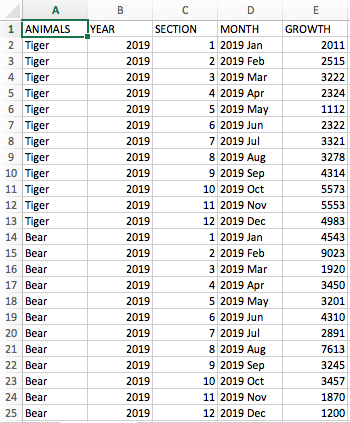
How would I code a line graph on Python with my csv file - animals listed on the y-axis, months listed on the x-axis, and
How would I code a line graph on Python with my csv file - animals listed on the y-axis, months listed on the x-axis, and the growth values plotted (for each animal?)
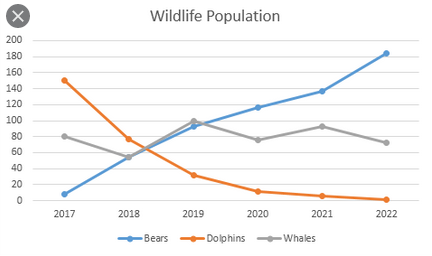
Example from google:
Step by Step Solution
There are 3 Steps involved in it
Step: 1

Get Instant Access to Expert-Tailored Solutions
See step-by-step solutions with expert insights and AI powered tools for academic success
Step: 2

Step: 3
Ace Your Homework with AI
Get the answers you need in no time with our AI-driven, step-by-step assistance
Get Started
Database Management System MCQs Multiple Choice Questions And Answers
Authors: Arshad Iqbal
1st Edition
1073328554, 978-1073328550