how would i do this ?
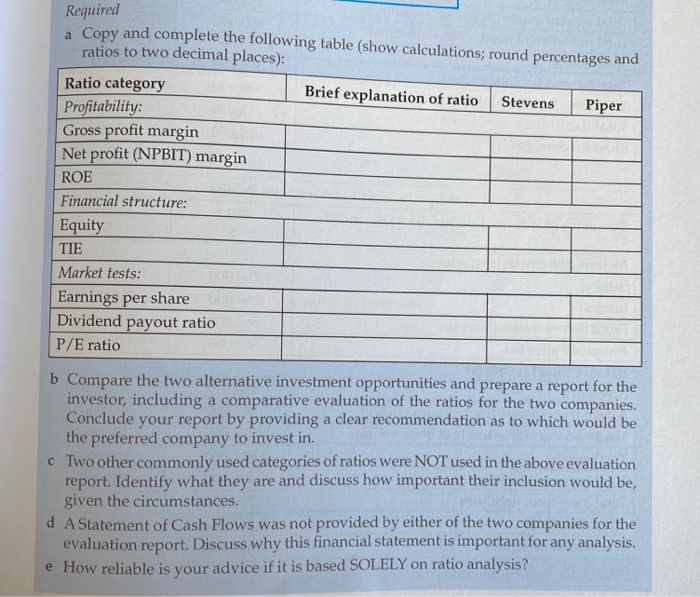
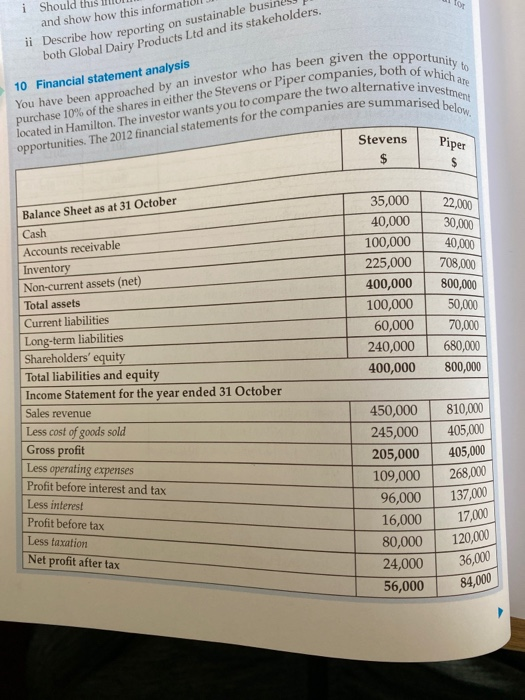
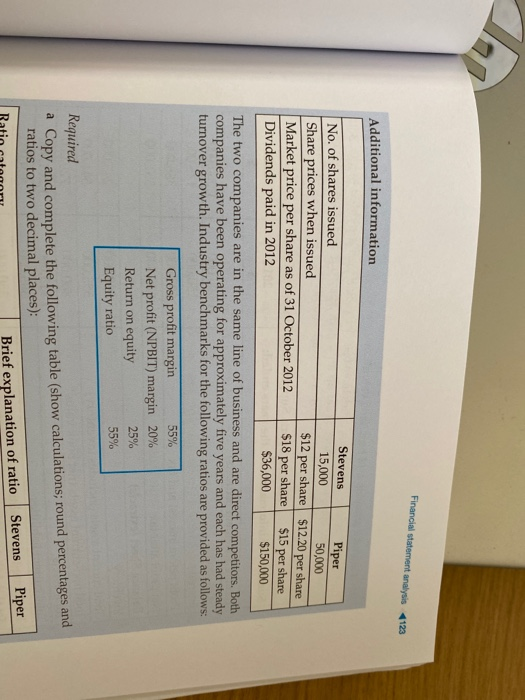
Required a Copy and complete the following table (show calculations; round percentages and ratios to two decimal places): Ratio category Brief explanation of ratio Stevens Piper Profitability: Gross profit margin Net profit (NPBIT) margin ROE Financial structure: Equity TIE Market tests: Earnings per share Dividend payout ratio P/E ratio b Compare the two alternative investment opportunities and prepare a report for the investor, including a comparative evaluation of the ratios for the two companies. Conclude your report by providing a clear recommendation as to which would be the preferred company to invest in. c Two other commonly used categories of ratios were NOT used in the above evaluation report. Identify what they are and discuss how important their inclusion would be, given the circumstances. d A Statement of Cash Flows was not provided by either of the two companies for the evaluation report. Discuss why this financial statement is important for any analysis. e How reliable is your advice if it is based SOLELY on ratio analysis? You have been approached by an investor who has been given the opportunity to purchase 10% of the shares in either the Stevens or Piper companies, both of which are opportunities. The 2012 financial statements for the companies are summarised below. located in Hamilton. The investor wants you to compare the two alternative investment i Should 10 and show how this informal ii Describe how reporting on sustainable busi both Global Dairy Products Ltd and its stakeholders. 10 Financial statement analysis Stevens $ Piper Balance Sheet as at 31 October Cash Accounts receivable Inventory Non-current assets (net) Total assets Current liabilities Long-term liabilities 35,000 40,000 100,000 225,000 400,000 100,000 60,000 240,000 400,000 22,000 30,000 40,000 708,000 800,000 50,000 70,000 680,000 800,000 Shareholders' equity Total liabilities and equity Income Statement for the year ended 31 October Sales revenue Less cost of goods sold 450,000 245,000 205,000 109,000 96,000 16,000 80,000 24,000 56,000 810,000 405,000 405,000 268,000 137,000 Gross profit Less operating expenses Profit before interest and tax Less interest Profit before tax Less taxation Net profit after tax 17,000 120,000 36,000 84,000 Financial statement analysis (123 $18 per Additional information Stevens Piper No. of shares issued 15,000 50,000 Share prices when issued $12 per share $12.20 per share Market price per share as of 31 October 2012 share $15 per share Dividends paid in 2012 $36,000 $150,000 The two companies are in the same line of business and are direct competitors. Both companies have been operating for approximately five years and each has had steady turnover growth. Industry benchmarks for the following ratios are provided as follows: 55% Gross profit margin Net profit (NPBIT) margin 20% 25% Return on equity 55% Equity ratio Required a Copy and complete the following table (show calculations, round percentages and ratios to two decimal places): Brief explanation of ratio Stevens Piper Required a Copy and complete the following table (show calculations; round percentages and ratios to two decimal places): Ratio category Brief explanation of ratio Stevens Piper Profitability: Gross profit margin Net profit (NPBIT) margin ROE Financial structure: Equity TIE Market tests: Earnings per share Dividend payout ratio P/E ratio b Compare the two alternative investment opportunities and prepare a report for the investor, including a comparative evaluation of the ratios for the two companies. Conclude your report by providing a clear recommendation as to which would be the preferred company to invest in. c Two other commonly used categories of ratios were NOT used in the above evaluation report. Identify what they are and discuss how important their inclusion would be, given the circumstances. d A Statement of Cash Flows was not provided by either of the two companies for the evaluation report. Discuss why this financial statement is important for any analysis. e How reliable is your advice if it is based SOLELY on ratio analysis? You have been approached by an investor who has been given the opportunity to purchase 10% of the shares in either the Stevens or Piper companies, both of which are opportunities. The 2012 financial statements for the companies are summarised below. located in Hamilton. The investor wants you to compare the two alternative investment i Should 10 and show how this informal ii Describe how reporting on sustainable busi both Global Dairy Products Ltd and its stakeholders. 10 Financial statement analysis Stevens $ Piper Balance Sheet as at 31 October Cash Accounts receivable Inventory Non-current assets (net) Total assets Current liabilities Long-term liabilities 35,000 40,000 100,000 225,000 400,000 100,000 60,000 240,000 400,000 22,000 30,000 40,000 708,000 800,000 50,000 70,000 680,000 800,000 Shareholders' equity Total liabilities and equity Income Statement for the year ended 31 October Sales revenue Less cost of goods sold 450,000 245,000 205,000 109,000 96,000 16,000 80,000 24,000 56,000 810,000 405,000 405,000 268,000 137,000 Gross profit Less operating expenses Profit before interest and tax Less interest Profit before tax Less taxation Net profit after tax 17,000 120,000 36,000 84,000 Financial statement analysis (123 $18 per Additional information Stevens Piper No. of shares issued 15,000 50,000 Share prices when issued $12 per share $12.20 per share Market price per share as of 31 October 2012 share $15 per share Dividends paid in 2012 $36,000 $150,000 The two companies are in the same line of business and are direct competitors. Both companies have been operating for approximately five years and each has had steady turnover growth. Industry benchmarks for the following ratios are provided as follows: 55% Gross profit margin Net profit (NPBIT) margin 20% 25% Return on equity 55% Equity ratio Required a Copy and complete the following table (show calculations, round percentages and ratios to two decimal places): Brief explanation of ratio Stevens Piper