

Answered step by step
Verified Expert Solution
Question
1 Approved Answer
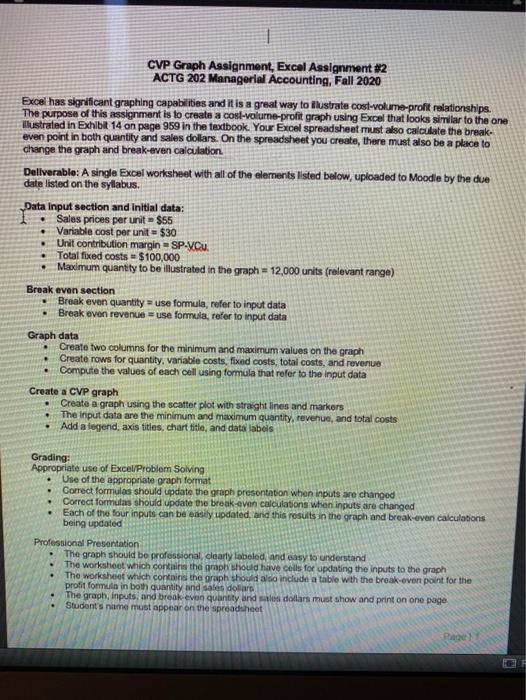
How would I go about making a graph for this and finding the break even quanity, break even revenue, variable cost, quantity, fixed costs and
How would I go about making a graph for this and finding the break even quanity, break even revenue, variable cost, quantity, fixed costs and revenue?
Step by Step Solution
There are 3 Steps involved in it
Step: 1

Get Instant Access to Expert-Tailored Solutions
See step-by-step solutions with expert insights and AI powered tools for academic success
Step: 2

Step: 3
Ace Your Homework with AI
Get the answers you need in no time with our AI-driven, step-by-step assistance
Get Started
Using QuickBooks Online For Accounting
Authors: Glenn Owen
3rd Edition
0357391691, 9780357391693