Answered step by step
Verified Expert Solution
Link Copied!

Question

1 Approved Answer

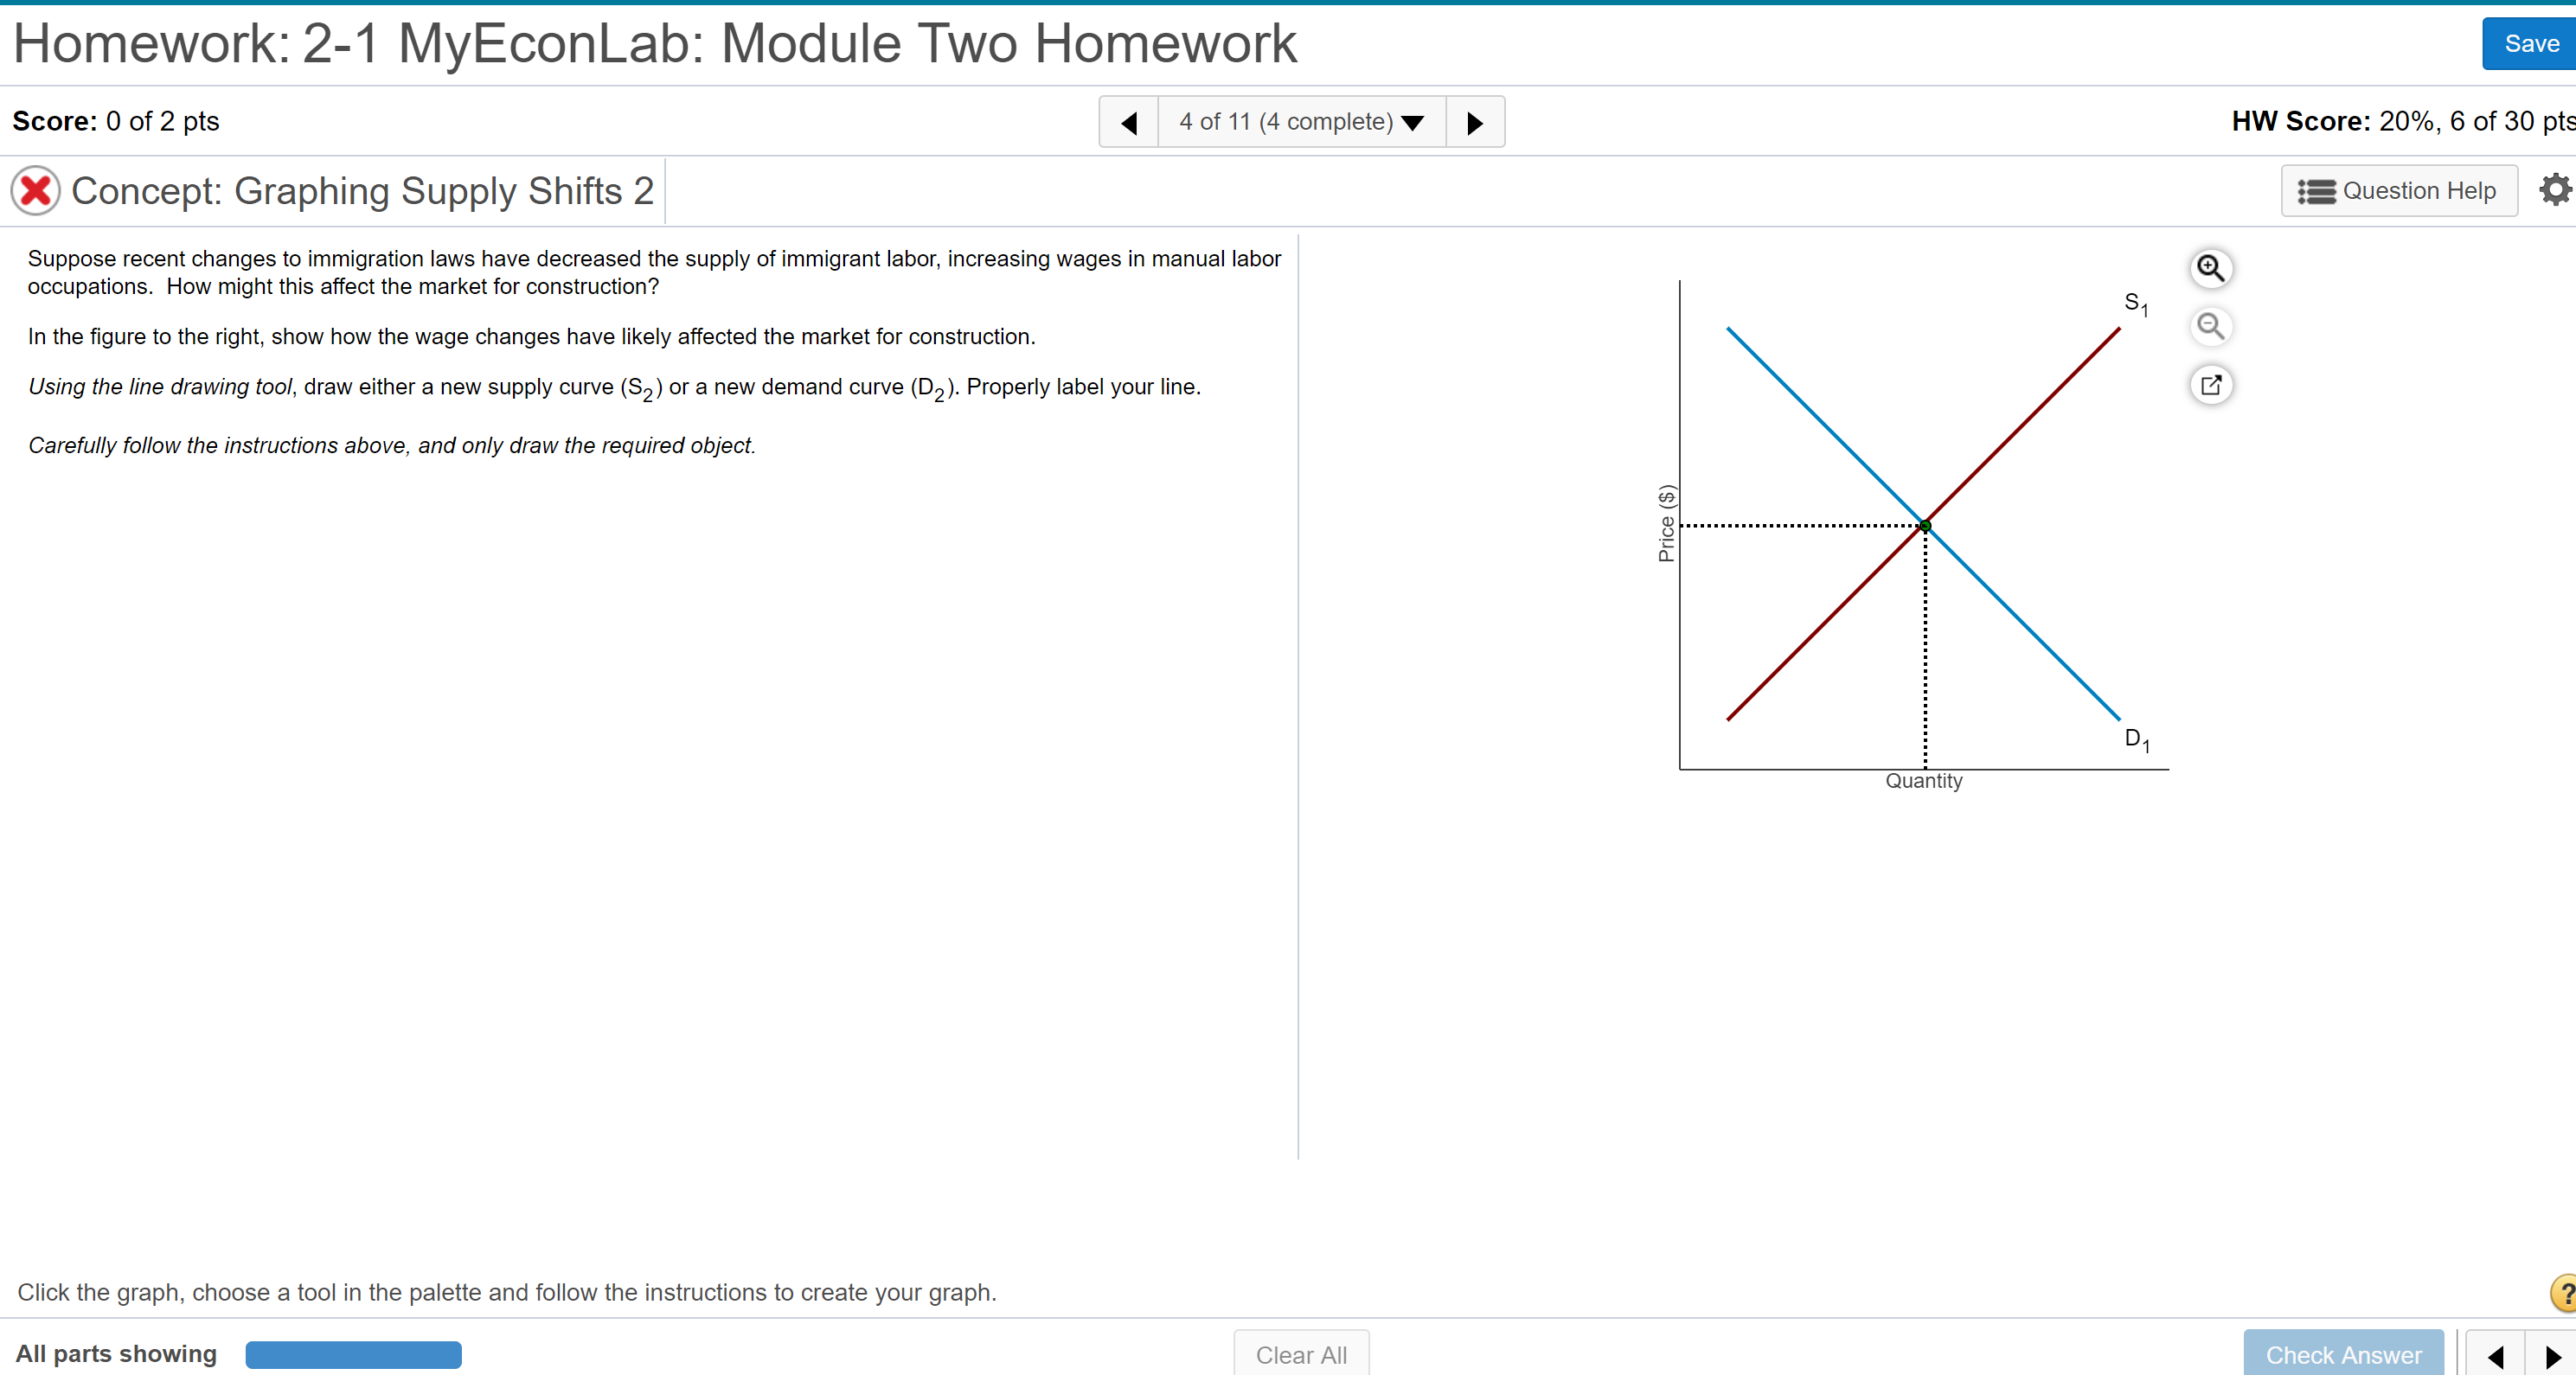
How would I solve this? Homework: 2-1 MyEconLab: Module Two Homework Save Score: 0 of 2 pts 4 of 11 (4 complete) HW Score: 20%,

How would I solve this?

image text in transcribed
Homework: 2-1 MyEconLab: Module Two Homework Save Score: 0 of 2 pts 4 of 11 (4 complete) HW Score: 20%, 6 of 30 pt X Concept: Graphing Supply Shifts 2 Question Help Suppose recent changes to immigration laws have decreased the supply of immigrant labor, increasing wages in manual labor occupations. How might this affect the market for construction? In the figure to the right, show how the wage changes have likely affected the market for construction. Using the line drawing tool, draw either a new supply curve ($2) or a new demand curve (D2). Properly label your line. Carefully follow the instructions above, and only draw the required object. Price ($) D1 Quantity Click the graph, choose a tool in the palette and follow the instructions to create your graph. All parts showing Clear All Check

Step by Step Solution

There are 3 Steps involved in it

Step: 1

blur-text-image

Get Instant Access to Expert-Tailored Solutions

See step-by-step solutions with expert insights and AI powered tools for academic success

Step: 2

blur-text-image

Step: 3

blur-text-image

Ace Your Homework with AI

Get the answers you need in no time with our AI-driven, step-by-step assistance

Get Started

Recommended Textbook for

Managerial Economics and Business Strategy

Authors: Michael R. baye

7th Edition

978-0073375960, 71267441, 73375969, 978-0071267441

More Books

Students also viewed these Economics questions

Question

=+ b. A change in weather patterns increases the depreciation rate.

Answered: 1 week ago