Answered step by step
Verified Expert Solution
Link Copied!

Question

1 Approved Answer

http://physics.bu.edu/~duffy/HTML5/RLC_circuit.html Experiment 55 2. Open up the simulation. The input voltage is shown in purple, and we will take the output across the resistor, shown

http://physics.bu.edu/~duffy/HTML5/RLC_circuit.html
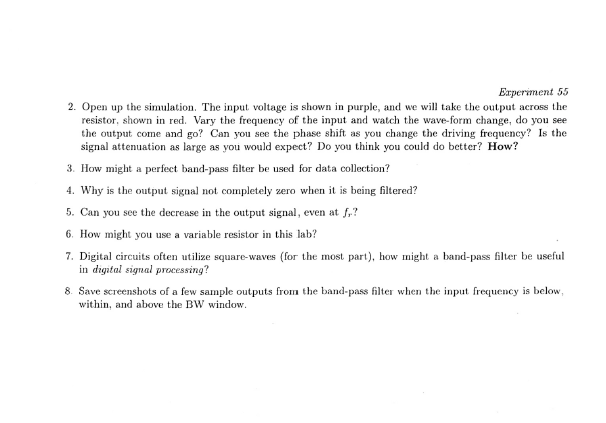
image text in transcribed
Experiment 55 2. Open up the simulation. The input voltage is shown in purple, and we will take the output across the resistor, shown in red. Vary the frequency of the input and watch the wave-form change, do you see the output come and go? Can you see the phase shift as you change the driving frequency? Is the signal attenuateon as large as you would expect? Do you think you could do better? How? 3. How might a perfect band-pass filter be used for data collection? 4. Why is the output signal not completely zero when it is being filtered? 5. Can you see the decrease in the output signal, even at f,? 6. How might you use a variable resistor in this lab? 7. Digital circuits often utilize square-waves (for the most part), how might a band-pass filter be useful in digital signal processing? 8. Save screenshots of a few sample outputs from the band-pass filter when the input frequency is below, within, and above the BW window

Step by Step Solution

There are 3 Steps involved in it

Step: 1

blur-text-image

Get Instant Access to Expert-Tailored Solutions

See step-by-step solutions with expert insights and AI powered tools for academic success

Step: 2

blur-text-image_2

Step: 3

blur-text-image_3

Ace Your Homework with AI

Get the answers you need in no time with our AI-driven, step-by-step assistance

Get Started

Recommended Textbook for

College Physics

Authors: Raymond A. Serway, Jerry S. Faughn, Chris Vuille, Charles A. Bennett

7th Edition

9780534997236, 495113697, 534997236, 978-0495113690

More Books

Students also viewed these Physics questions