

Answered step by step
Verified Expert Solution
Question
1 Approved Answer
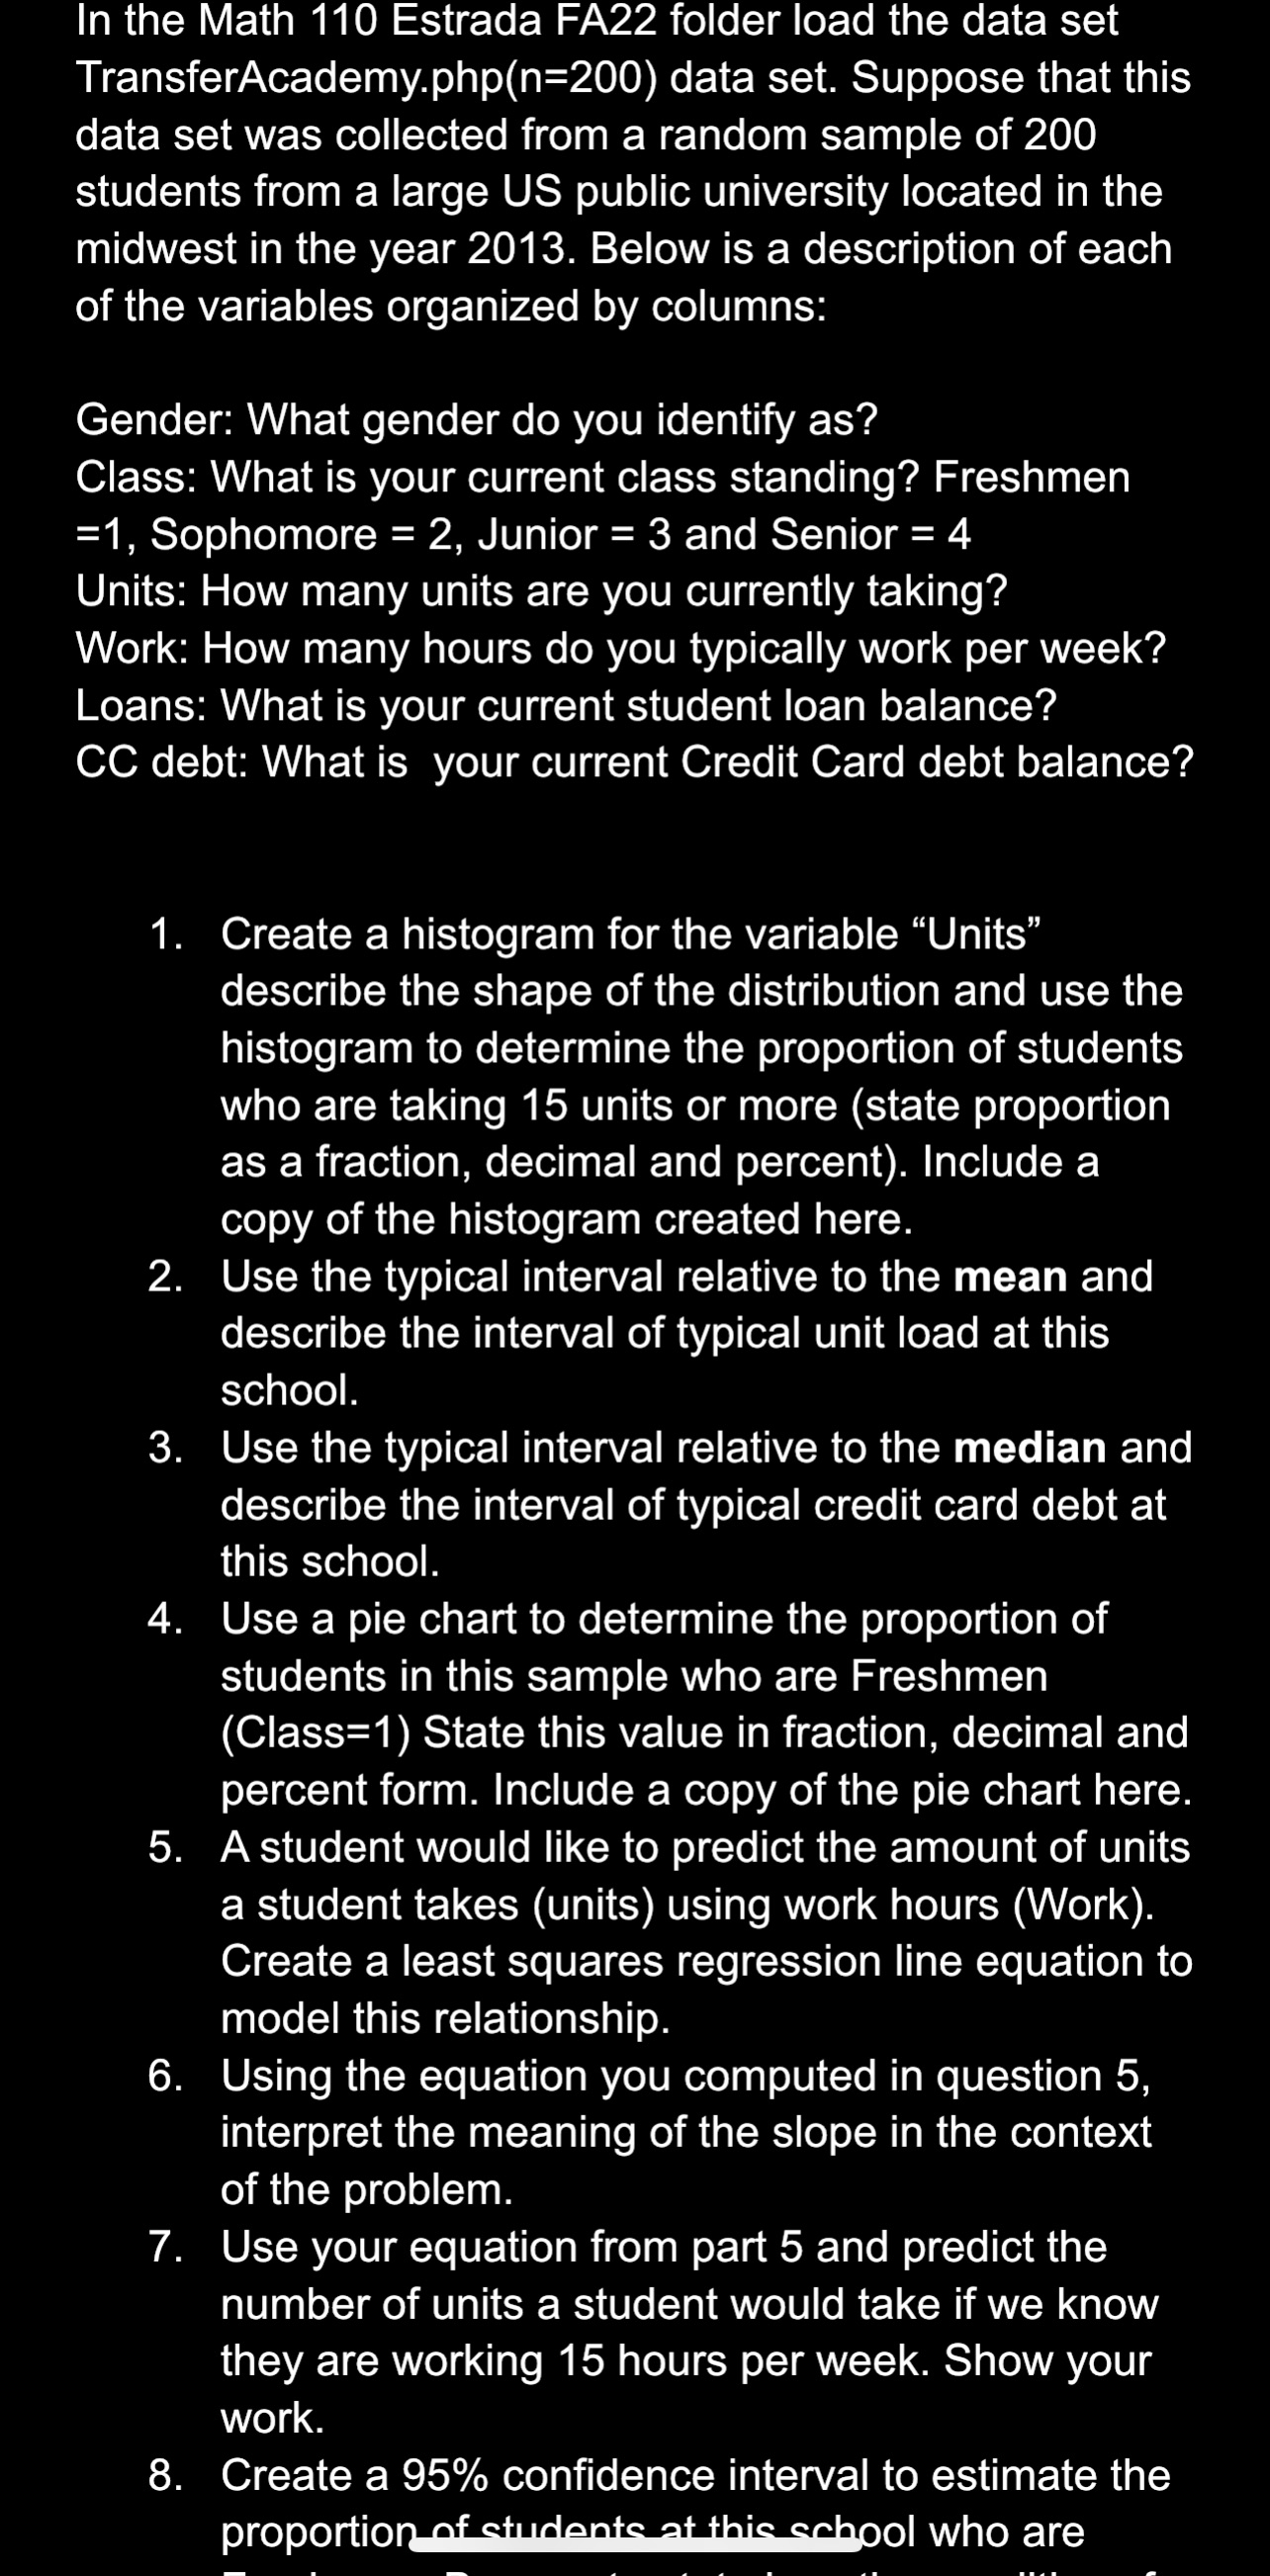
https://1drv.ms/x/c/c25bc623cf46c049/EeAr49m9LWtMjMtzOXqGNc4Bst7VHHy0CfZ5SHfHia3a8A?e=4%3a605f15fb2112461fa5bb62cb5dd1148c&sharingv2=true&fromShare=true&at=9 In the Math 110 Estrada FA22 folder load the data set TransferAcademy.php(n=200) data set. Suppose that this data set was collected from a random
https://1drv.ms/x/c/c25bc623cf46c049/EeAr49m9LWtMjMtzOXqGNc4Bst7VHHy0CfZ5SHfHia3a8A?e=4%3a605f15fb2112461fa5bb62cb5dd1148c&sharingv2=true&fromShare=true&at=9
Step by Step Solution
There are 3 Steps involved in it
Step: 1

Get Instant Access to Expert-Tailored Solutions
See step-by-step solutions with expert insights and AI powered tools for academic success
Step: 2

Step: 3
Ace Your Homework with AI
Get the answers you need in no time with our AI-driven, step-by-step assistance
Get Started
Precalculus
Authors: Michael Sullivan
9th edition
321716835, 321716833, 978-0321716835