Answered step by step
Verified Expert Solution
Link Copied!

Question

1 Approved Answer

Find the indicated 1Q score. The graph to the right depicts 1Q scores of adults, and those scores are normally distributed with a mean of
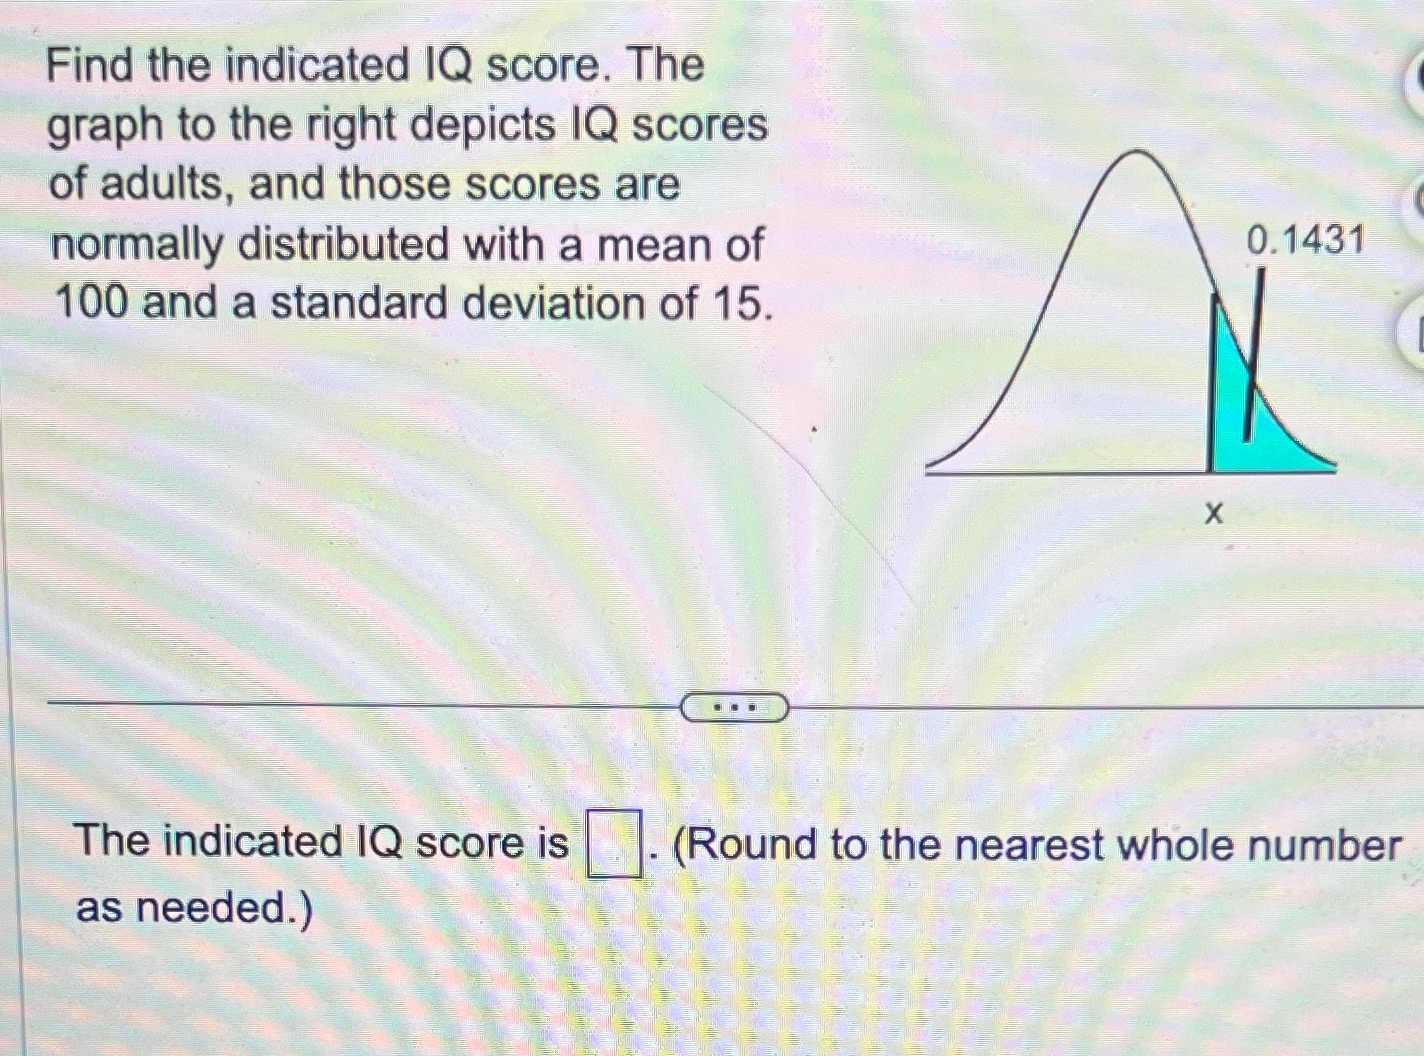
image text in transcribed
Find the indicated 1Q score. The graph to the right depicts 1Q scores of adults, and those scores are normally distributed with a mean of 100 and a standard deviation of 15. The indicated IQ score ns _ ('Rc:cunld' to the nearest whole number as needed.)

Step by Step Solution

There are 3 Steps involved in it

Step: 1

blur-text-image

Get Instant Access to Expert-Tailored Solutions

See step-by-step solutions with expert insights and AI powered tools for academic success

Step: 2

blur-text-image

Step: 3

blur-text-image

Ace Your Homework with AI

Get the answers you need in no time with our AI-driven, step-by-step assistance

Get Started

Recommended Textbook for

Precalculus

Authors: Michael Sullivan

9th edition

321716835, 321716833, 978-0321716835

More Books

Students also viewed these Mathematics questions

Question

Why are the Chinese such heavy users of the Internet?

Answered: 1 week ago

Question

=+ Do we motivate stewardship behavior?

Answered: 1 week ago

Question

Define the purpose of continuous improvement of quality

Answered: 1 week ago