https://data.worldbank.org/
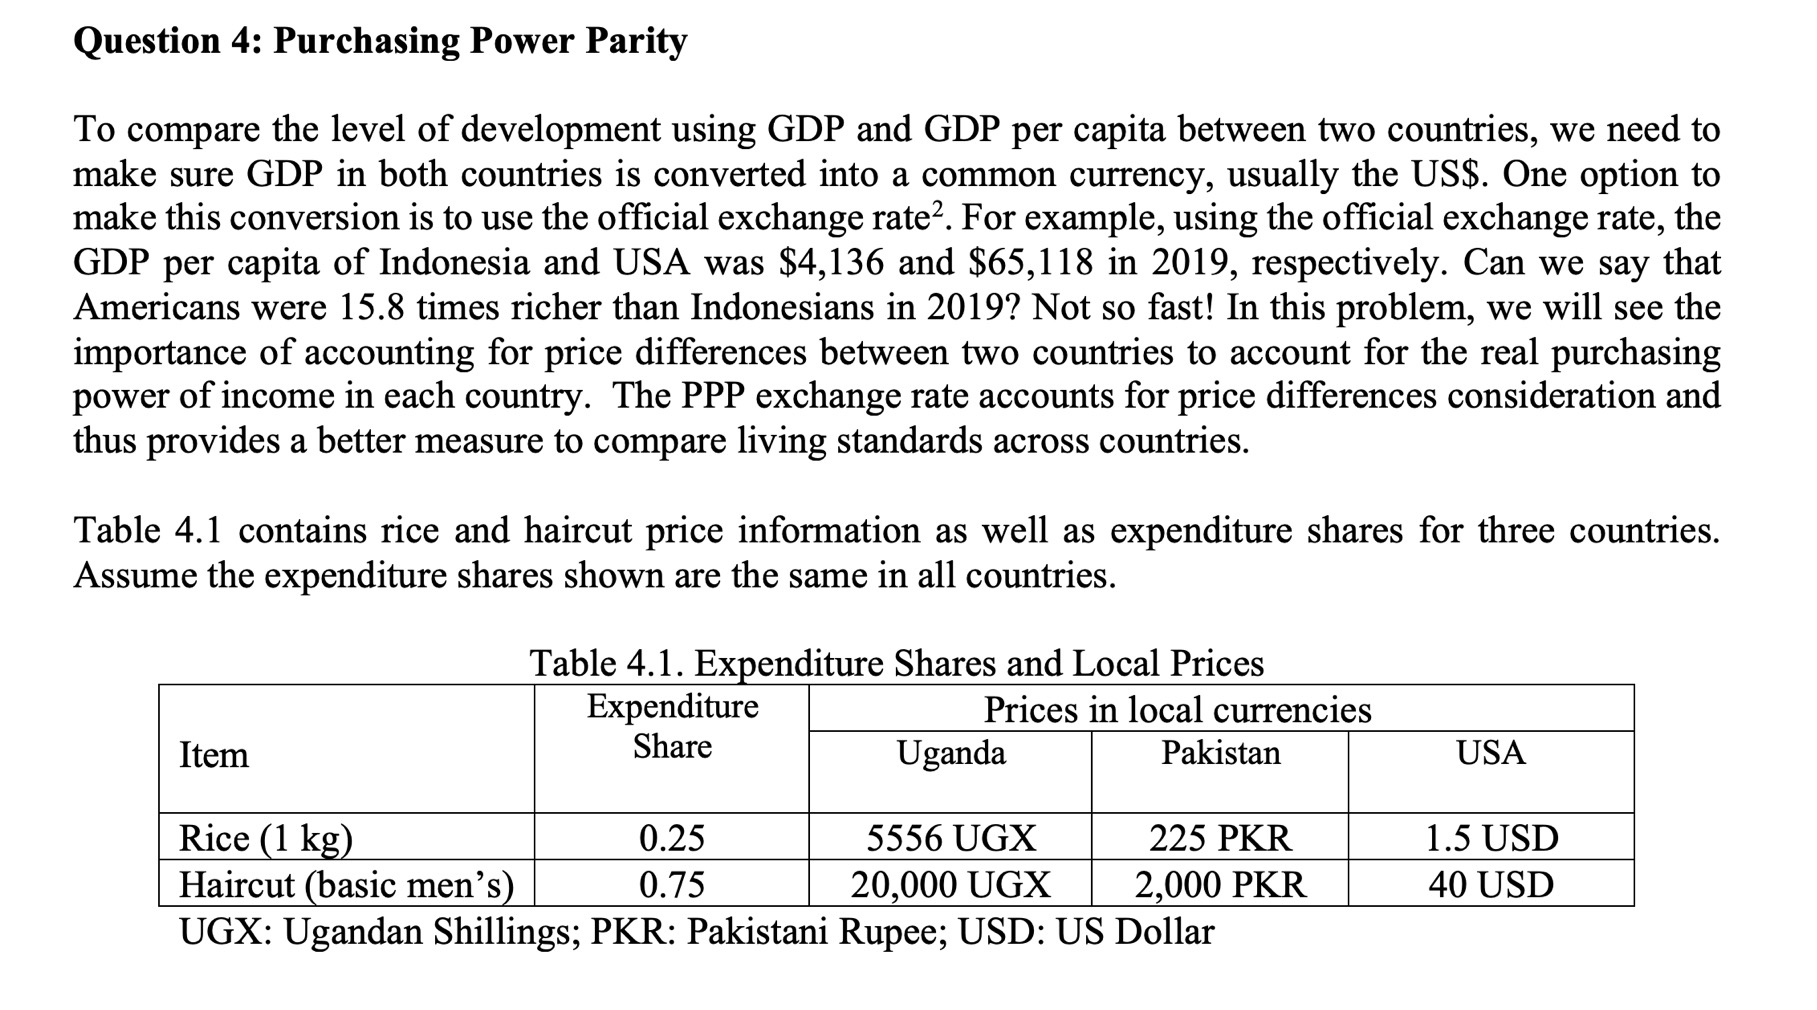
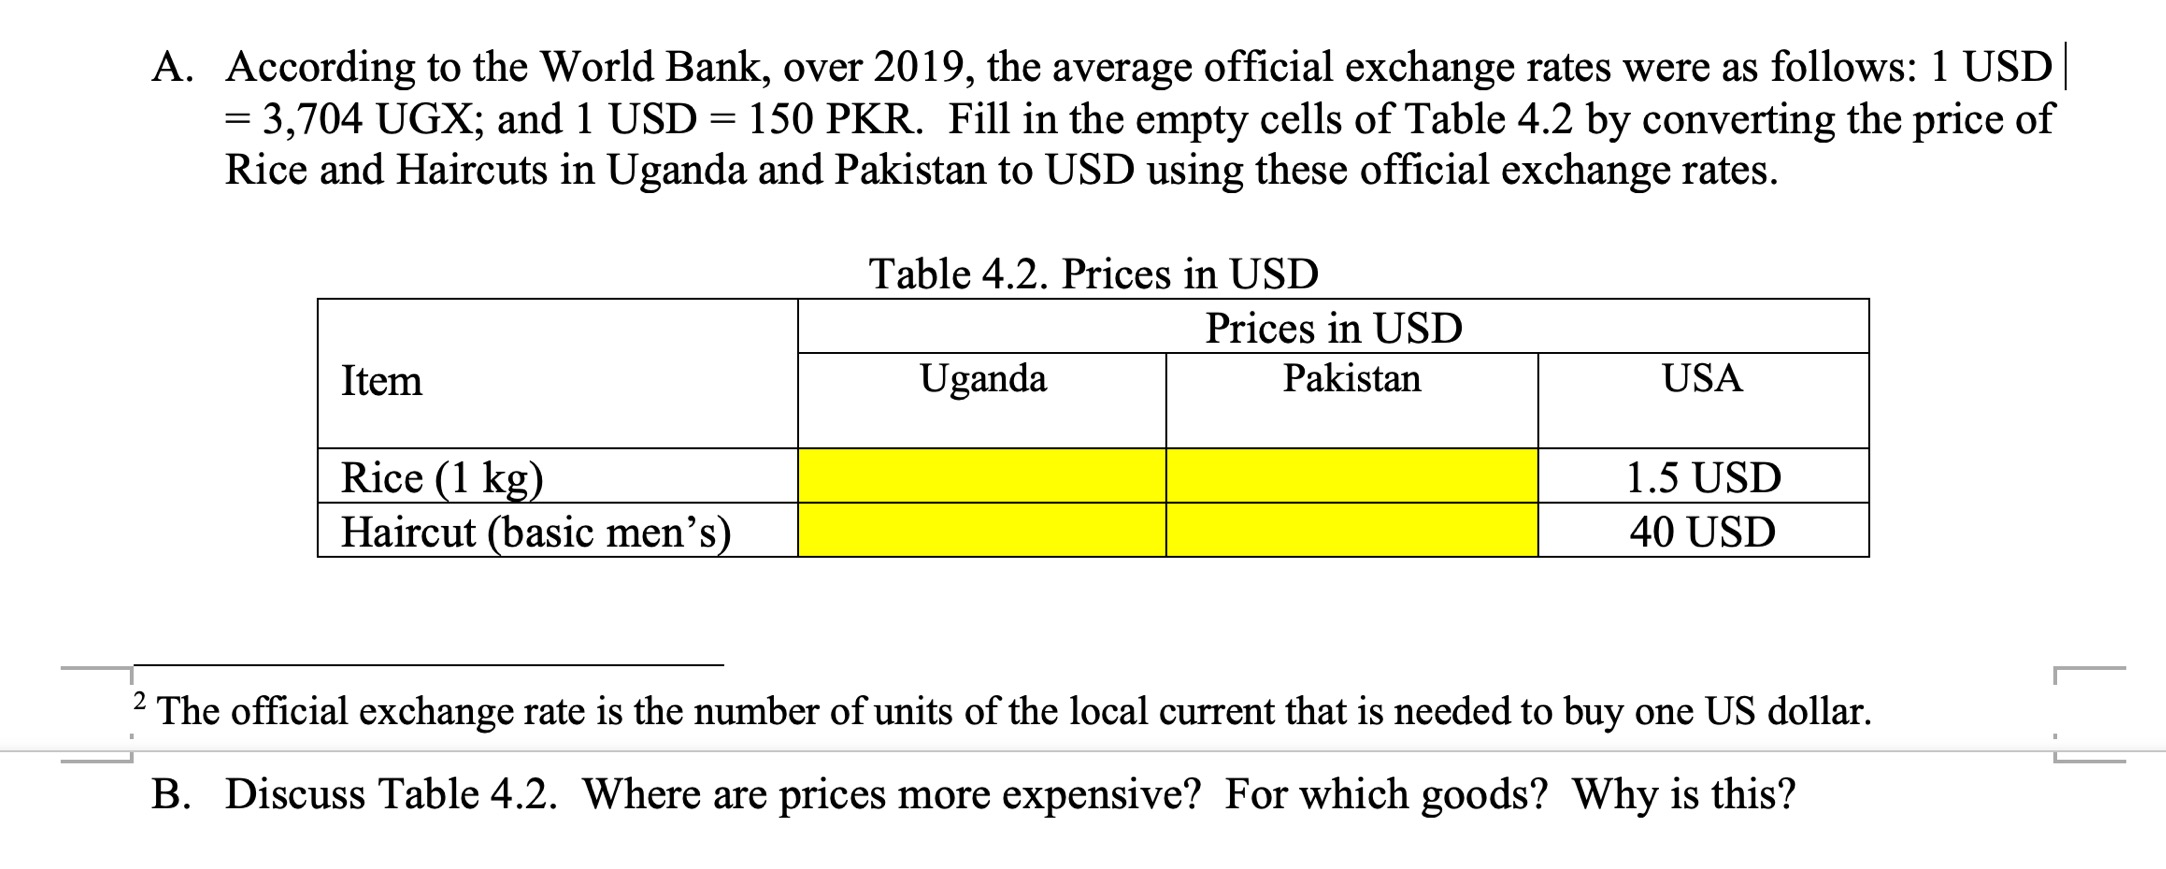
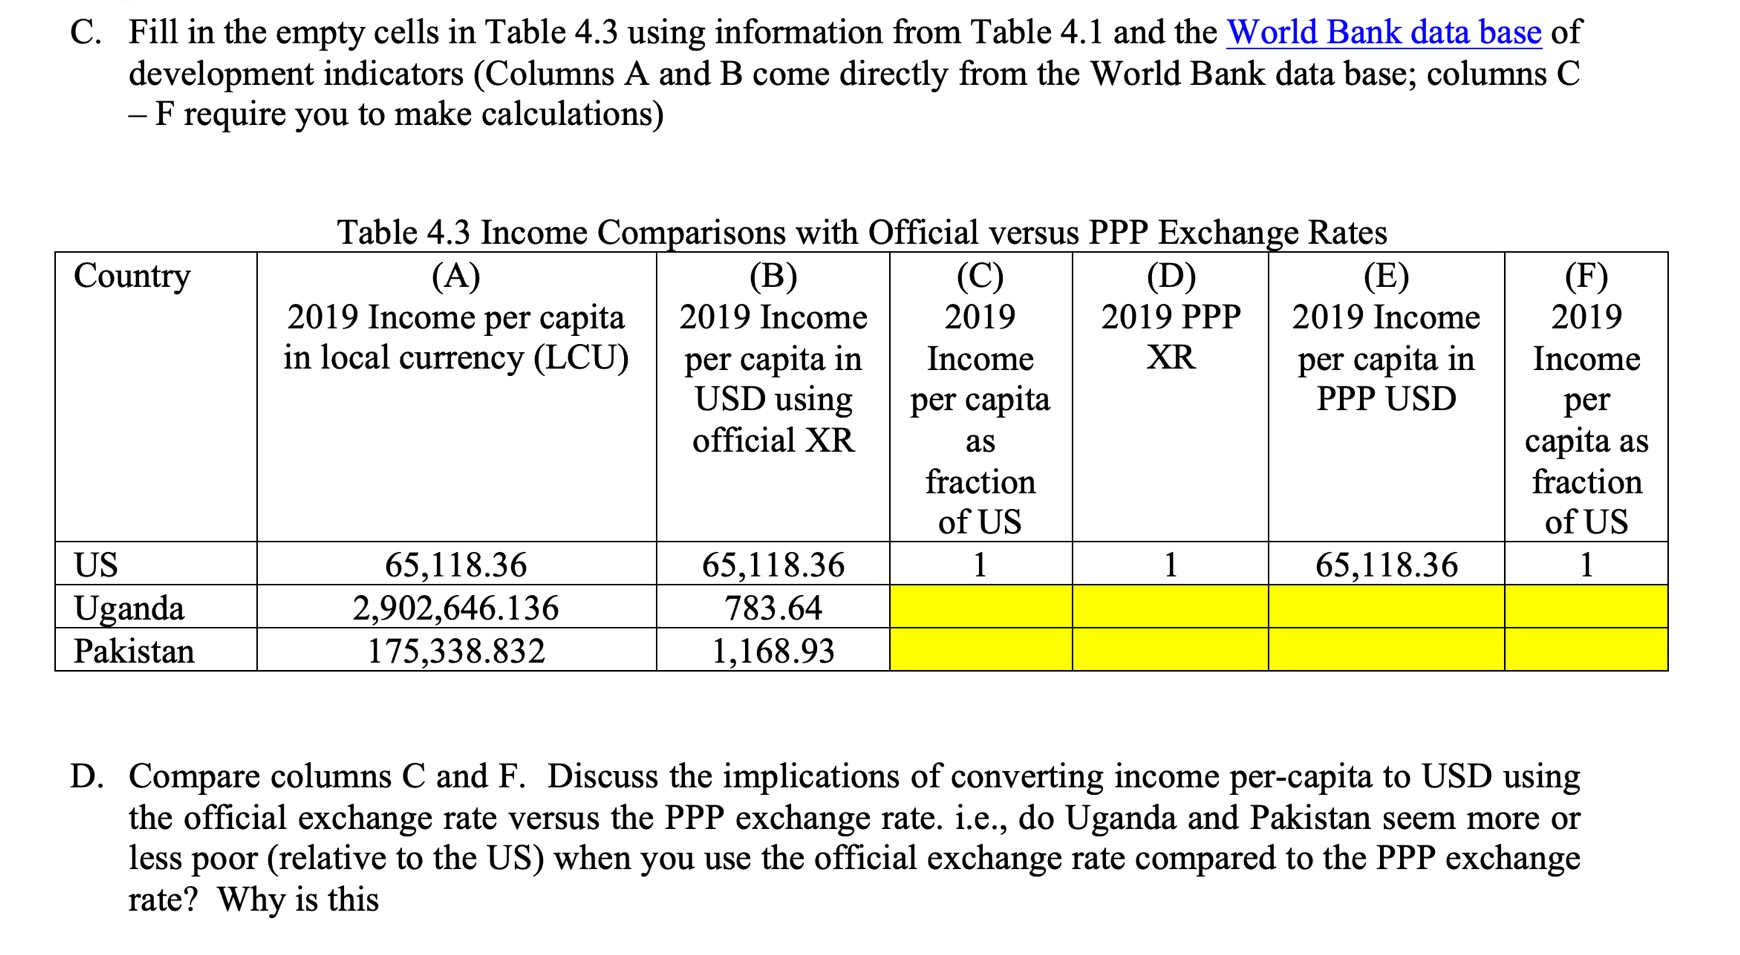
Question 4: Purchasing Power Parity To compare the level of development using GDP and GDP per capita between two countries, we need to make sure GDP in both countries is converted into a common currency, usually the US$. One option to make this conversion is to use the official exchange rate?. For example, using the official exchange rate, the GDP per capita of Indonesia and USA was $4,136 and $65,118 in 2019, respectively. Can we say that Americans were 15.8 times richer than Indonesians in 2019? Not so fast! In this problem, we will see the importance of accounting for price differences between two countries to account for the real purchasing power of income in each country. The PPP exchange rate accounts for price differences consideration and thus provides a better measure to compare living standards across countries. Table 4.1 contains rice and haircut price information as well as expenditure shares for three countries. Assume the expenditure shares shown are the same in all countries. Table 4.1. Expenditure Shares and Local Prices Expenditure Prices in local currencies Item Share Uganda Pakistan USA Rice (1 kg) 0.25 5556 UGX 225 PKR 1.5 USD Haircut (basic men's) 0.75 20,000 UGX 2,000 PKR 40 USD UGX: Ugandan Shillings; PKR: Pakistani Rupee; USD: US DollarA. According to the World Bank, over 2019, the average official exchange rates were as follows: 1 USD = 3,704 UGX; and 1 USD = 150 PKR. Fill in the empty cells of Table 4.2 by converting the price of Rice and Haircuts in Uganda and Pakistan to USD using these official exchange rates. Table 4.2. Prices in USD Prices in USD Item Uganda Pakistan USA Rice (1 kg) 1.5 USD Haircut (basic men's) 40 USD 2 The official exchange rate is the number of units of the local current that is needed to buy one US dollar. B. Discuss Table 4.2. Where are prices more expensive? For which goods? Why is this?C. Fill in the empty cells in Table 4.3 using information from Table 4.1 and the World Bank data base of development indicators (Columns A and B come directly from the World Bank data base; columns C - F require you to make calculations) Table 4.3 Income Comparisons with Official versus PPP Exchange Rates Country (A) (B) (C) (D) (E) (F) 2019 Income per capita 2019 Income 2019 2019 PPP 2019 Income 2019 in local currency (LCU) per capita in Income XR per capita in Income USD using per capita PPP USD per official XR as capita as fraction fraction of US of US US 65,118.36 65,118.36 1 65,118.36 1 Uganda 2,902,646.136 783.64 Pakistan 175,338.832 1,168.93 D. Compare columns C and F. Discuss the implications of converting income per-capita to USD using the official exchange rate versus the PPP exchange rate. i.e., do Uganda and Pakistan seem more or rate? Why is this less poor (relative to the US) when you use the official exchange rate compared to the PPP exchange


