

Question: https://drive.google.com/file/d/1yHTWolhe6w2TTg7zO9EWzXYA8zXY0WJN/view?usp=share_link CSV file is available through that link Data Description The data set is contained in a comma-separated value (csv) file named CDN_hprice.csv with column

 https://drive.google.com/file/d/1yHTWolhe6w2TTg7zO9EWzXYA8zXY0WJN/view?usp=share_link
CSV file is available through that link
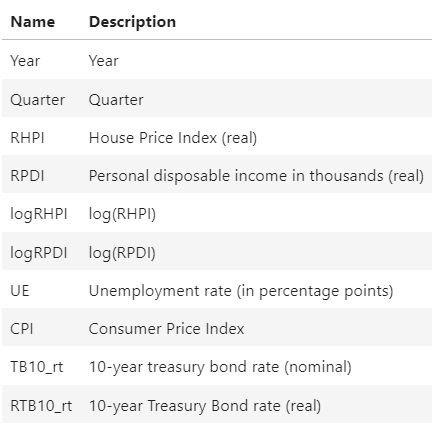
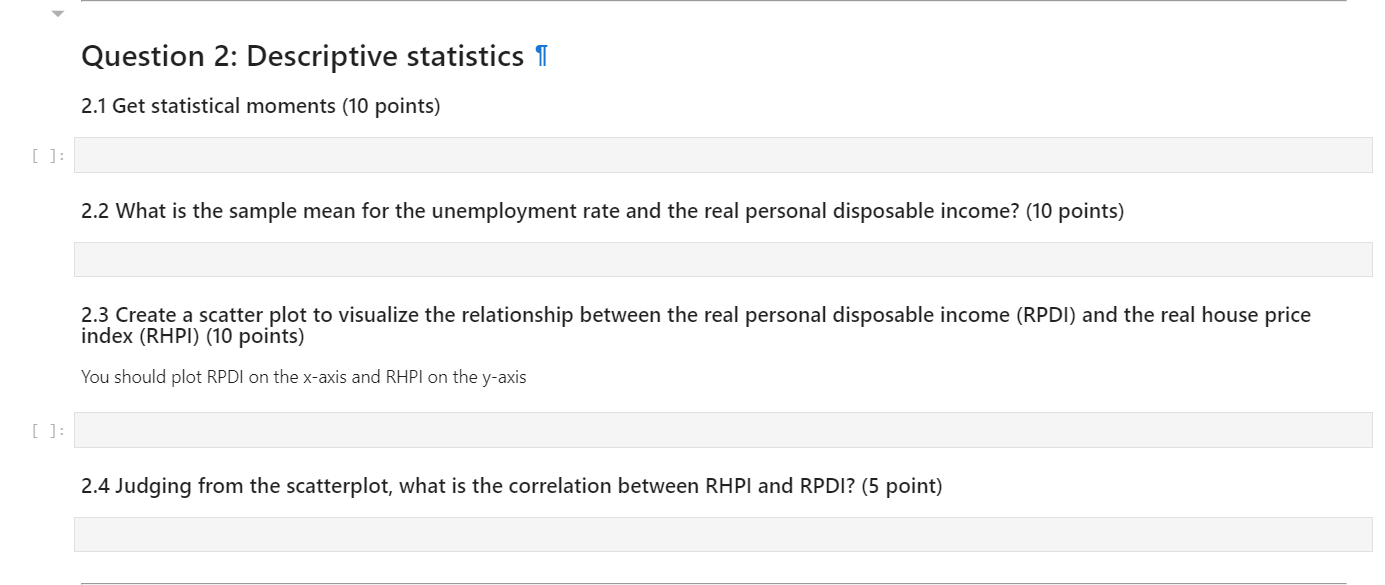
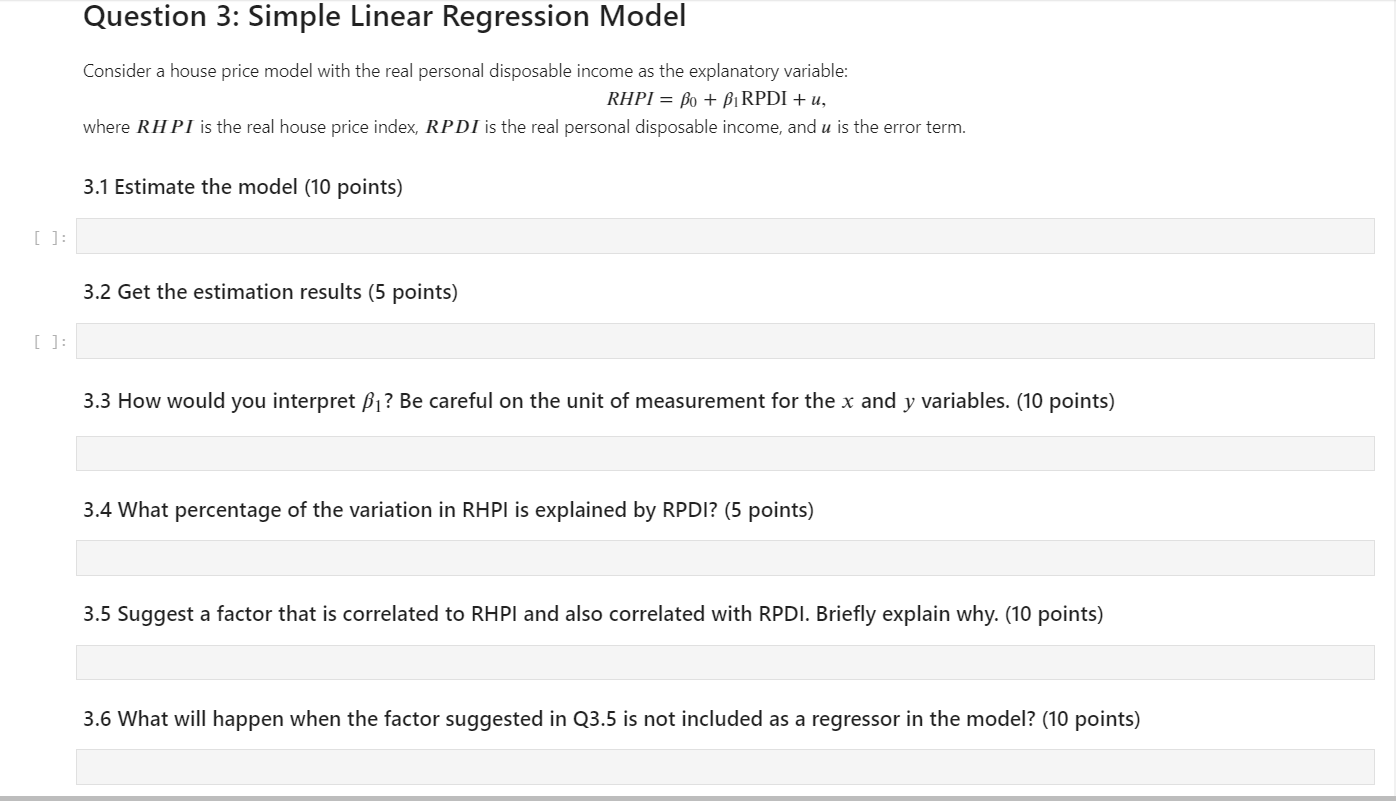
Data Description The data set is contained in a comma-separated value (csv) file named CDN_hprice.csv with column headers. The data is a set of quarterly observations on a housing price index and other relevant variables in Canada for 1976 through 2019. This data set is obtained from Federal Reserve Bank of Dallas's International House Price Database. Description of the data is as follow: Name Description Year Year Quarter Quarter RHPI House Price Index (real) RPDI Personal disposable income in thousands (real) logRHPIlog(RHPI) logRPDI log( RPDI) UE Unemployment rate (in percentage points) CPI Consumer Price Index TB10_rt 10-year treasury bond rate (nominal) RTB10_rt 10-year Treasury Bond rate (real) import numpy as np import pandas as pc import statsmodels import statsmodels.api as sm import statsmodels. formula.api as smf import matplotlib.pyplot Question 1: Import the data set 1.1 Load the data set into Python (5 points) Question 2: Descriptive statistics 2.1 Get statistical moments (10 points) 2.2 What is the sample mean for the unemployment rate and the real personal disposable income? (10 points) 2.3 Create a scatter plot to visualize the relationship between the real personal disposable income (RPDI) and the real house price index (RHPI) (10 points) You should plot RPDI on the x-axis and RHPI on the y-axis 2.4 Judging from the scatterplot, what is the correlation between RHPI and RPDI? (5 point) Question 3: Simple Linear Regression Model Consider a house price model with the real personal disposable income as the explanatory variable: RHPI=0+1RPDI+u, where RHPI is the real house price index, RPDI is the real personal disposable income, and u is the error term. 3.1 Estimate the model (10 points) ]: 3.2 Get the estimation results (5 points) ]: 3.3 How would you interpret 1 ? Be careful on the unit of measurement for the x and y variables. (10 points) 3.4 What percentage of the variation in RHPI is explained by RPDI? (5 points) 3.5 Suggest a factor that is correlated to RHPI and also correlated with RPDI. Briefly explain why. (10 points) 3.6 What will happen when the factor suggested in Q3.5 is not included as a regressor in the model? (10 points) 3.7 It is not meaningful to discuss the relationship between RHPI and RPDI, because RHPI is just an index value. (5 points) Suggest how you can rewrite the model to estimate the relationship between the real house price growth and the level of real personal disposable income
Step by Step Solution
There are 3 Steps involved in it

Get step-by-step solutions from verified subject matter experts