Answered step by step
Verified Expert Solution
Question
1 Approved Answer
https://s3.us-east-1.amazonaws.com/blackboard.learn.xythos.prod/5a31b9b8c288e/510106?response-content-disposition=inline%3B%20filename%2A%3DUTF-8%27%27datosprocesovt%25281%2529.txt&response-content-type=text%2Fplain&X-Amz-Algorithm=AWS4-HMAC-SHA256&X-Amz-Date=20181104T190150Z&X-Amz-SignedHeaders=host&X-Amz-Expires=21600&X-Amz-Credential=AKIAIL7WQYDOOHAZJGWQ%2F20181104%2Fus-east-1%2Fs3%2Faws4_request&X-Amz-Signature=69efca97a00677b512c05ba957bcf665b892ecede0e10fc54e675916921d3f70 1. The attached file contains 2000 input data u(k) and output y(k) from a time-varying process (the first column is u(k) and the second
https://s3.us-east-1.amazonaws.com/blackboard.learn.xythos.prod/5a31b9b8c288e/510106?response-content-disposition=inline%3B%20filename%2A%3DUTF-8%27%27datosprocesovt%25281%2529.txt&response-content-type=text%2Fplain&X-Amz-Algorithm=AWS4-HMAC-SHA256&X-Amz-Date=20181104T190150Z&X-Amz-SignedHeaders=host&X-Amz-Expires=21600&X-Amz-Credential=AKIAIL7WQYDOOHAZJGWQ%2F20181104%2Fus-east-1%2Fs3%2Faws4_request&X-Amz-Signature=69efca97a00677b512c05ba957bcf665b892ecede0e10fc54e675916921d3f70
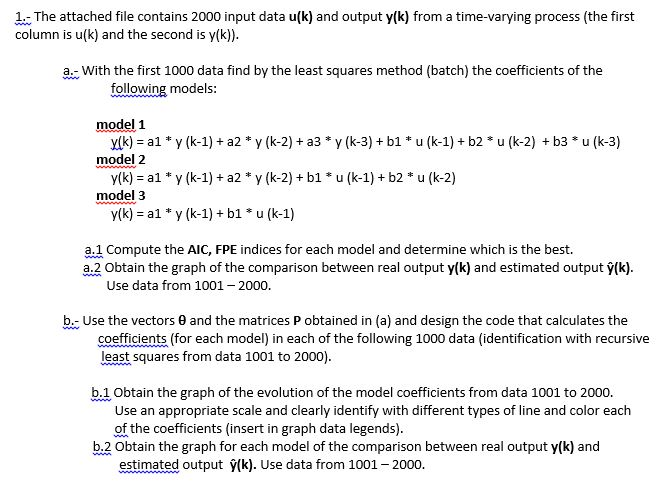
1. The attached file contains 2000 input data u(k) and output y(k) from a time-varying process (the first column is u(k) and the second is y(k)) a With the first 1000 data find by the least squares method (batch) the coefficients of the following models: model 1 y(k) -aly (k-1) a2*y (k-2)+ a3 model 2 (k-3) + b1* u (k-1) + b2 u (k-2) b3 * u (k-3) y(k) aly (k-1) a2*y (k-2)+ b1 model 3 u (k-1)+b2 * u (k-2) y(k) alY (k-1)+ bl u (k-1) a.1 Compute the AIC, FPE indices for each model and determine which is the best. a2 Obtain the graph of the comparison between real output y(k) and estimated output y(k). Use data from 1001-2000. b Use the vectors 0 and the matrices P obtained in (a) and design the code that calculates the coefficients (for each model) in each of the following 1000 data (identification with recursive least squares from data 1001 to 2000) b.1 Obtain the graph of the evolution of the model coefficients from data 1001 to 2000. Use an appropriate scale and clearly identify with different types of line and color each of the coefficients (insert in graph data legends) b.2 Obtain the graph for each model of the comparison between real output y(k) and estimated output y(k) Use data from 1001-2000. 1. The attached file contains 2000 input data u(k) and output y(k) from a time-varying process (the first column is u(k) and the second is y(k)) a With the first 1000 data find by the least squares method (batch) the coefficients of the following models: model 1 y(k) -aly (k-1) a2*y (k-2)+ a3 model 2 (k-3) + b1* u (k-1) + b2 u (k-2) b3 * u (k-3) y(k) aly (k-1) a2*y (k-2)+ b1 model 3 u (k-1)+b2 * u (k-2) y(k) alY (k-1)+ bl u (k-1) a.1 Compute the AIC, FPE indices for each model and determine which is the best. a2 Obtain the graph of the comparison between real output y(k) and estimated output y(k). Use data from 1001-2000. b Use the vectors 0 and the matrices P obtained in (a) and design the code that calculates the coefficients (for each model) in each of the following 1000 data (identification with recursive least squares from data 1001 to 2000) b.1 Obtain the graph of the evolution of the model coefficients from data 1001 to 2000. Use an appropriate scale and clearly identify with different types of line and color each of the coefficients (insert in graph data legends) b.2 Obtain the graph for each model of the comparison between real output y(k) and estimated output y(k) Use data from 1001-2000Step by Step Solution
There are 3 Steps involved in it
Step: 1

Get Instant Access to Expert-Tailored Solutions
See step-by-step solutions with expert insights and AI powered tools for academic success
Step: 2

Step: 3
Ace Your Homework with AI
Get the answers you need in no time with our AI-driven, step-by-step assistance
Get Started