

Question
https://www.chegg.com/homework-help/questions-and-answers/problem-1-votes-women-please-using-python-solve-following-problem-link-csv-doc-https-cours-q108378432 Using this same prompt that was previously answered on Chegg, I must answer the same question in simpler code. -Instead of using pandas I
https://www.chegg.com/homework-help/questions-and-answers/problem-1-votes-women-please-using-python-solve-following-problem-link-csv-doc-https-cours-q108378432
Using this same prompt that was previously answered on Chegg, I must answer the same question in simpler code.
-Instead of using pandas I need to use with open(FILE, "r") as infile:
-I am not able to use expressions such as these below (these are examples from a previously posted solution for the same word problem)
# Filter out rows with missing age values
data = data[data[data.columns[AGE_POSITION]].notna()]
# Convert age values to integer data
[data.columns[AGE_POSITION]] = data[data.columns[AGE_POSITION]].astype(int)
# Count the number of women in each age group
age_group_counts = data['Age Group'].value_counts().sort_index()
-Below I will insert grading notes given by the instructor
-The problem may call for a "for loop" to iterate by every line and process each variable at a time. It might also require slicing.
I am inserting a screenshot of the code used in class that was intended to help solve this problem, that might help you understand what kind of code level we are learning.
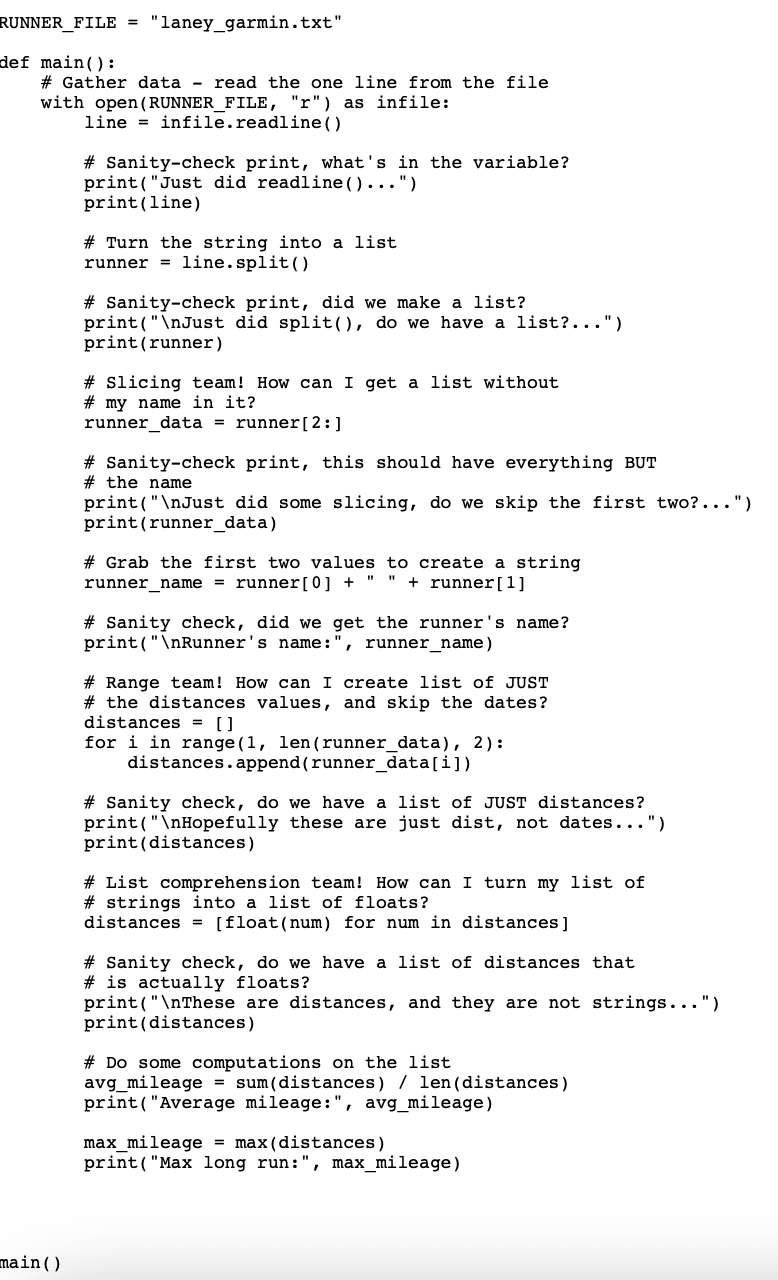
I know there may be faster commands to achieve the same problem but because I am in a beginner level class we have not reached certain topics. I still need to fulfill all requirements on the original post. Thanks
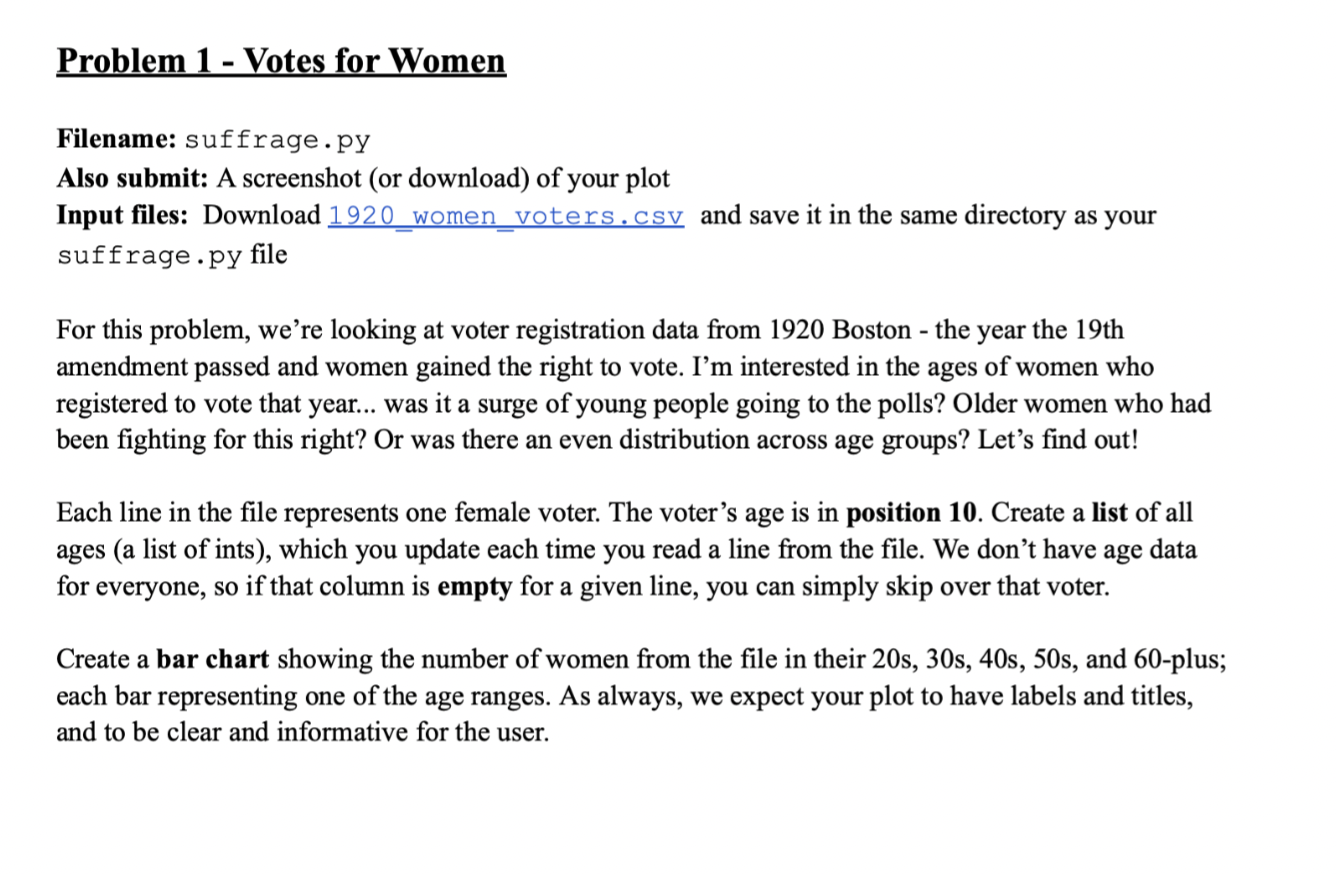
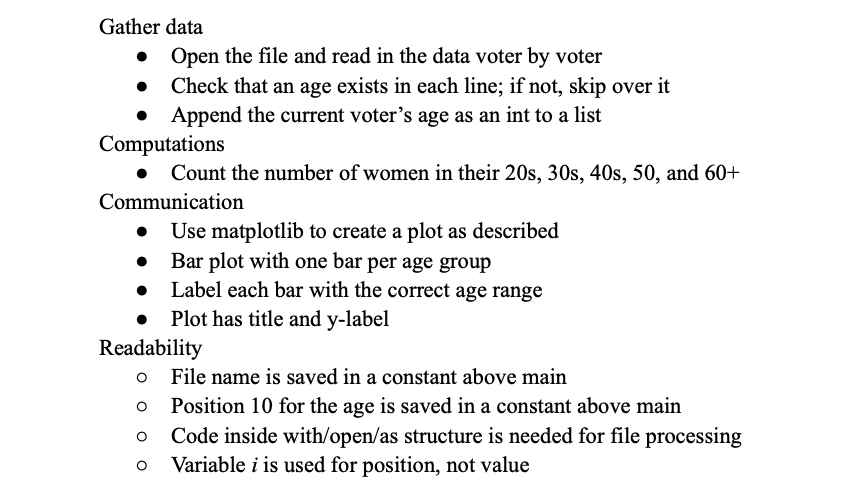
Filename: suffrage.py Also submit: A screenshot (or download) of your plot Input files: Download 1920 women voters.cSv and save it in the same directory as your suffrage.py file For this problem, we're looking at voter registration data from 1920 Boston - the year the 19th amendment passed and women gained the right to vote. I'm interested in the ages of women who registered to vote that year... was it a surge of young people going to the polls? Older women who had been fighting for this right? Or was there an even distribution across age groups? Let's find out! Each line in the file represents one female voter. The voter's age is in position 10. Create a list of all ages (a list of ints), which you update each time you read a line from the file. We don't have age data for everyone, so if that column is empty for a given line, you can simply skip over that voter. Create a bar chart showing the number of women from the file in their 20s,30s,40s,50s, and 60-plus; each bar representing one of the age ranges. As always, we expect your plot to have labels and titles, and to be clear and informative for the user. Gather data - Open the file and read in the data voter by voter - Check that an age exists in each line; if not, skip over it - Append the current voter's age as an int to a list Computations - Count the number of women in their 20s,30s,40s,50, and 60+ Communication - Use matplotlib to create a plot as described - Bar plot with one bar per age group - Label each bar with the correct age range - Plot has title and y-label Readability - File name is saved in a constant above main - Position 10 for the age is saved in a constant above main - Code inside with/open/as structure is needed for file processing - Variable i is used for position, not value ()Step by Step Solution
There are 3 Steps involved in it
Step: 1

Get Instant Access to Expert-Tailored Solutions
See step-by-step solutions with expert insights and AI powered tools for academic success
Step: 2

Step: 3
Ace Your Homework with AI
Get the answers you need in no time with our AI-driven, step-by-step assistance
Get Started
Current Trends In Database Technology Edbt 2006 Edbt 2006 Workshops Phd Datax Iidb Iiha Icsnw Qlqp Pim Parma And Reactivity On The Web Munich Germany March 2006 Revised Selected Papers Lncs 4254
Authors: Torsten Grust ,Hagen Hopfner ,Arantza Illarramendi ,Stefan Jablonski ,Marco Mesiti ,Sascha Muller ,Paula-Lavinia Patranjan ,Kai-Uwe Sattler ,Myra Spiliopoulou ,Jef Wijsen
2006th Edition
3540467882, 978-3540467885