Question
https://www.chegg.com/homework-help/questions-and-answers/q108544457?utm_source=Adobe&utm_medium=email&utm_campaign=cheggQuestionAnswered&utm_source=Braze&utm_medium=email&utm_campaign=MC_CS_Trn_YourQuestionAnswered_EML_0-P1&utm_content=MC_CS_Trn_YourQuestionAnswered_EML_0-P1 I asked this previous problem and when I run the code everything was fine except the bar chart didn't came out. Can you help
https://www.chegg.com/homework-help/questions-and-answers/q108544457?utm_source=Adobe&utm_medium=email&utm_campaign=cheggQuestionAnswered&utm_source=Braze&utm_medium=email&utm_campaign=MC_CS_Trn_YourQuestionAnswered_EML_0-P1&utm_content=MC_CS_Trn_YourQuestionAnswered_EML_0-P1
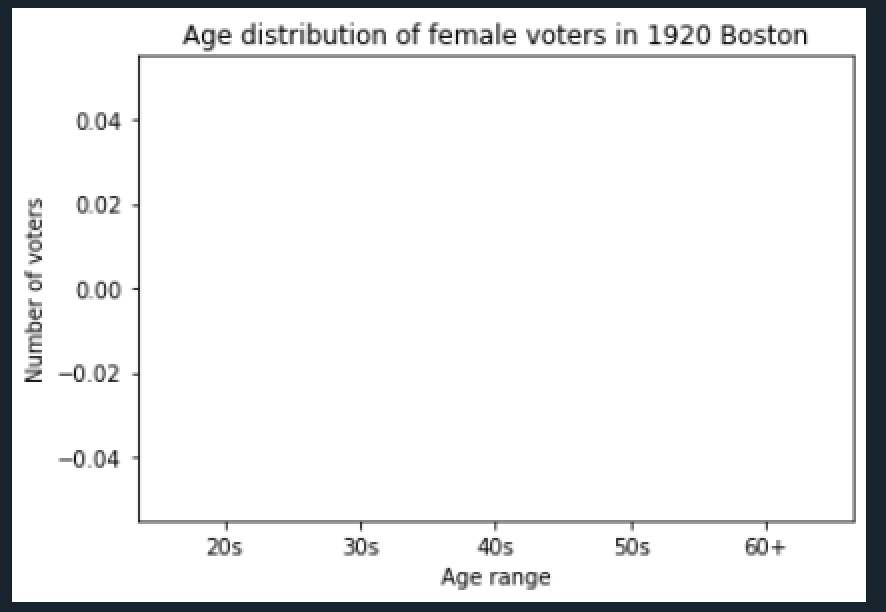
I asked this previous problem and when I run the code everything was fine except the bar chart didn't came out. Can you help me with this?
My code:
import csv import matplotlib.pyplot as plt
# Open the CSV file and read the ages of the female voters ages = [] with open('1920_women_voters.csv') as file: reader = csv.reader(file) for row in reader: try: age = int(row[9]) # Extract the age from the 10th column (index 9) if age >= 20: # Only include ages 20 and up ages.append(age) # Add the age to the list except ValueError: # Ignore rows with invalid age values or empty age column pass
# Compute the number of women in each age range counts = [0, 0, 0, 0, 0] # Initialize a list to hold the counts of women in each age range for age in ages: if age
# Create a bar chart ages_ranges = ["20s", "30s", "40s", "50s", "60+"] # Define the labels for the x-axis plt.bar(ages_ranges, counts) # Create the bar chart with the age ranges and counts plt.title("Age distribution of female voters in 1920 Boston") # Add a title to the chart plt.xlabel("Age range") # Label the x-axis plt.ylabel("Number of voters") # Label the y-axis plt.show() # Display the chart
image of the bar chart:
Step by Step Solution
There are 3 Steps involved in it
Step: 1

Get Instant Access to Expert-Tailored Solutions
See step-by-step solutions with expert insights and AI powered tools for academic success
Step: 2

Step: 3
Ace Your Homework with AI
Get the answers you need in no time with our AI-driven, step-by-step assistance
Get Started