Answered step by step
Verified Expert Solution
Link Copied!

Question

1 Approved Answer

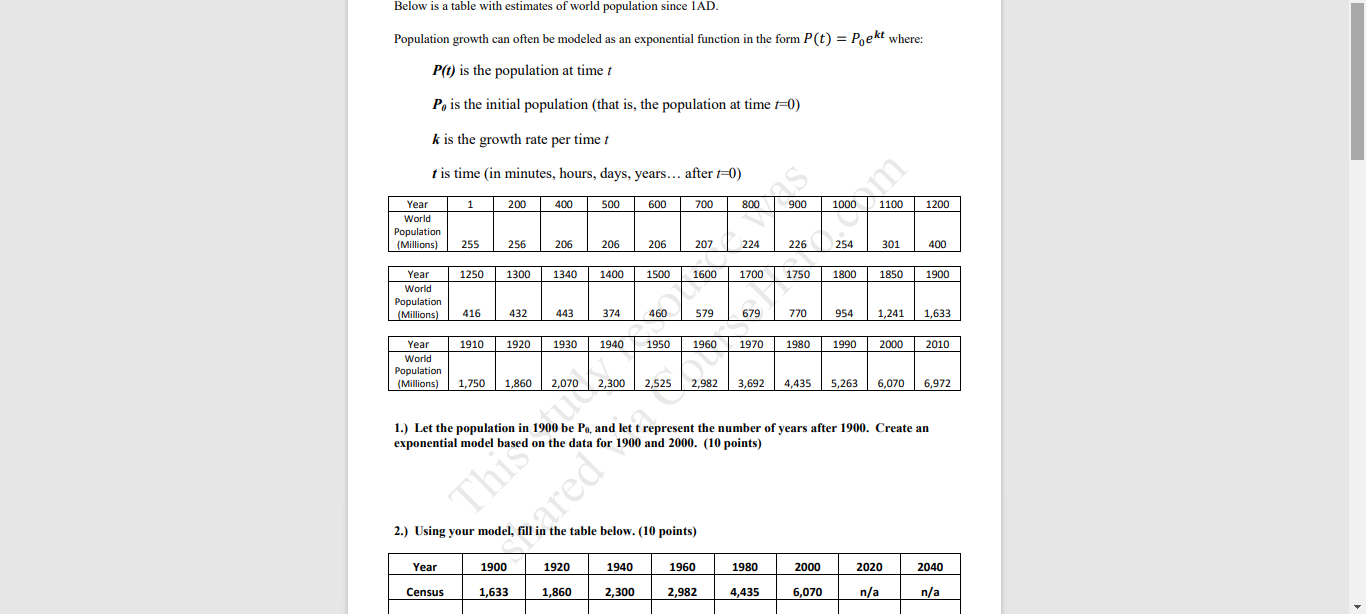
https://www.coursehero.com/u/file/53977106/WA-10-World-Populationpdf/#doc/qa help please. Below is a table with estimates of world population since 1AD. Population growth can often be modeled as an exponential function in

https://www.coursehero.com/u/file/53977106/WA-10-World-Populationpdf/#doc/qa

help please.

image text in transcribedimage text in transcribedimage text in transcribedimage text in transcribed
Below is a table with estimates of world population since 1AD. Population growth can often be modeled as an exponential function in the form P(t) = Poekt where: P(1) is the population at time t Po is the initial population (that is, the population at time =0) k is the growth rate per time t is time (in minutes, hours, days, years... after =0) Year 200 400 500 600 700 8:00 900 1000 1100 1200 World Population (Millions) 255 256 206 206 206 207 224 226 254 301 400 Year 1250 1300 1340 1400 1500 1600 1700 1750 1800 1850 1900 World Population (Millions) 416 432 443 374 460 579 579 770 954 1,241 1,633 Year 1910 1920 1930 1940 1950 1960 1970 1980 1990 2000 2010 Work Population (Millions) 1,750 1,860 2,070 2,300 2,525 2,982 3.692 4,435 5,263 6,070 6,972 1.) Let the population in 1900 be Po, and let t represent the number of years after 1900. Create an exponential model based on the data for 1900 and 2000. (10 points) This red 2.) Using your model, fill in the table below. (10 points) Year 1900 1920 1940 1960 1980 2000 2020 2040 Census 1,633 1,860 2,300 2,982 4,435 6,070 n/a n/a3.) The horizontal axis is labeled for you. Choose an appropriate scale for the vertical axis and graph your data from the table. Be sure to label which is the census data, and which is the model. (10 points) Population (millions) 1910 1920 1930 1940 1950 1960 1970 1980 1990 2000 2010 2020 2030 2040 4.) According to your model, in what year will the population reach 10 billion people? Lets create a second model using different years for data points. 5.) Let the population in 1940 be Po, and let t represent the number of years after 1940. Create an exponential model based on the data for 1940 and 1980. (10 points)6.) Using your model, fill in the table below. (10 Points) Year 1900 1920 1940 1960 1980 200 2020 2040 Census 1,633 1,860 2,300 2,982 4,435 6,070 n/a n/a https://www.coursehero.com/file/53977106/WA-10-World-Populationpdf Prepared by K. Gibbs and M. Sutherland Model 7.) The horizontal axis is labeled for you. Choose an appropriate scale for the vertical axis and graph your data from the table. Be sure to label which is the census data, and which is the model. (10 points) Population (millions)1910 1920 1930 1940 1950 1960 1970 1980 1990 2000 2010 2020 2030 2040 8.) According to this model, in what year will the population reach 10 billion people? (10 points) This ared 9.) Which model (the one based on 1900-2000 or the one based on 1940-1980) is better? (10 points) 10.) Do you think either of your models will be accurate for the year 2050? Why? (10 points)

Step by Step Solution

There are 3 Steps involved in it

Step: 1

blur-text-image

Get Instant Access to Expert-Tailored Solutions

See step-by-step solutions with expert insights and AI powered tools for academic success

Step: 2

blur-text-image

Step: 3

blur-text-image

Ace Your Homework with AI

Get the answers you need in no time with our AI-driven, step-by-step assistance

Get Started

Recommended Textbook for

Making Hard Decisions with decision tools

Authors: Robert Clemen, Terence Reilly

3rd edition

538797576, 978-0538797573

More Books

Students also viewed these Mathematics questions