https://www.dropbox.com/s/ji2mutxflpi8578/Balance.zip?dl=0


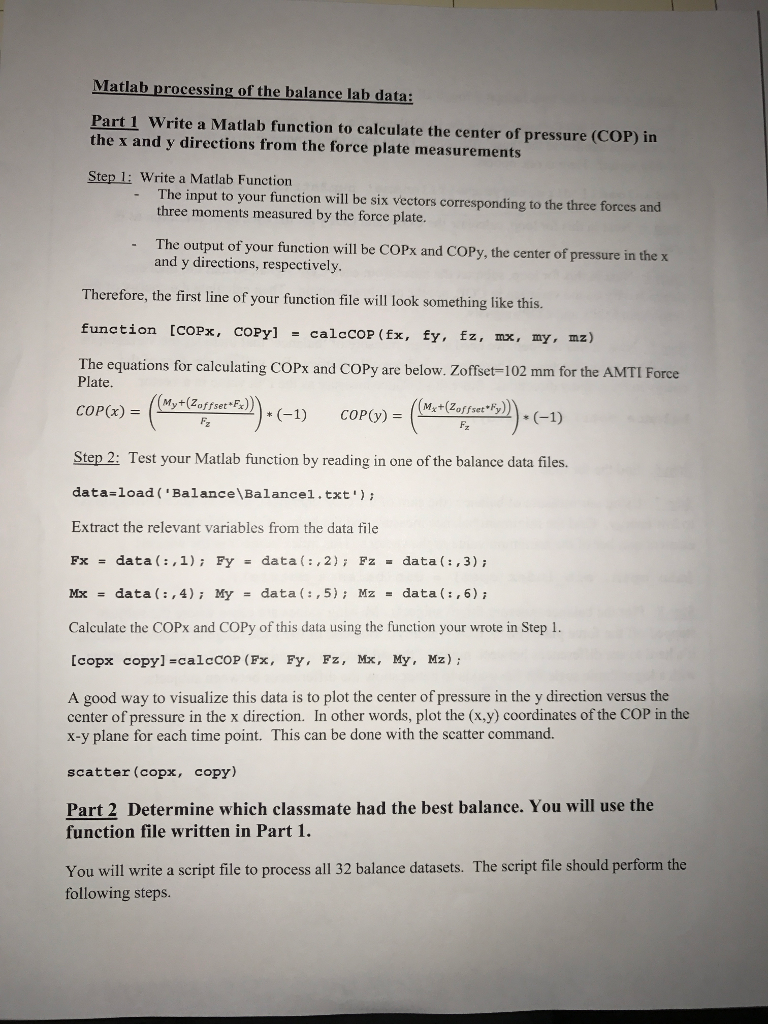
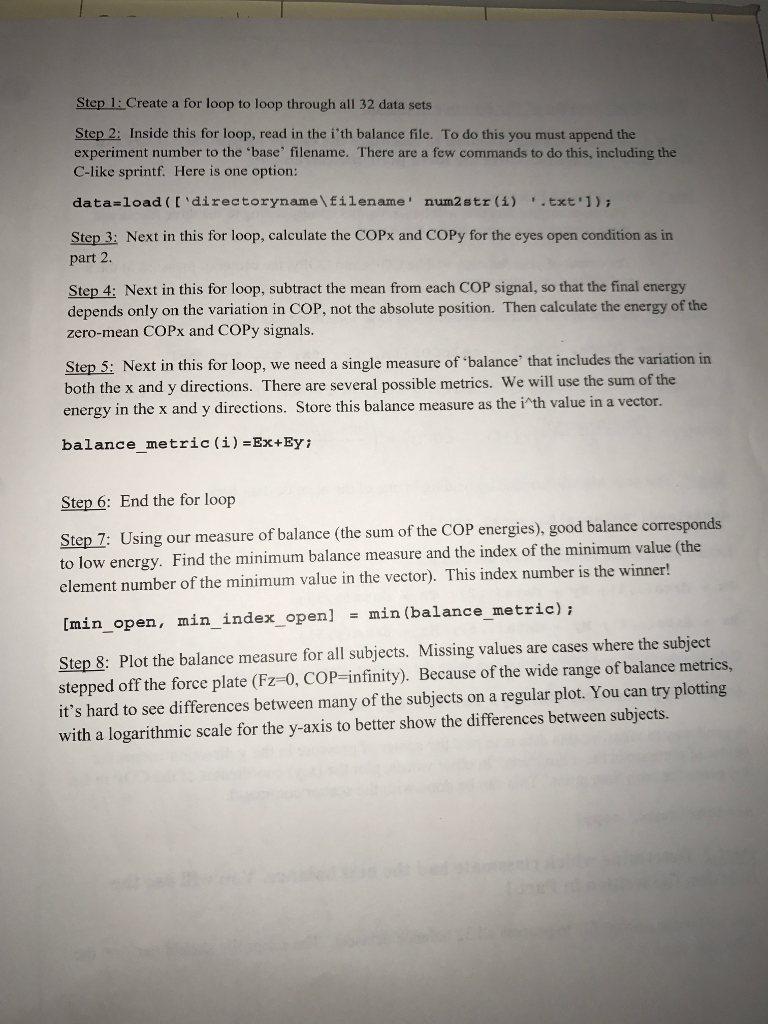
Matlab processing of the balance lab data: Part 1 Write a Matlab function to calculate the center of pressure (COP) in the x and y directions from the force plate measurements Step l: Write a Matlab Function The input to your function will be six vectors corresponding to the three forces and three moments measured by the force plate. - The output of your function will be COPx and coPy, the center of pressure in the x and y directions, respectively. Therefore, the first line of your function file will look something like this. function [COPX , COPy] = calcCOP(fx, fy, fz, mz) mx , my, The equations for calculating COPx and COPy are below. Zoffset-102 mm for the AMTI Force Plate. (myTeoffset.Fx)))*(-1) (Mxt(Zoffset )) COP(x) = Step 2: Test your Matlab function by reading in one of the balance data files. data-load ( 'Balance\Balancel.txt) Extract the relevant variables from the data file Fx = data ( : , 1) ; Fy- data ( : , 2 ) ; Fz -data ( : , 3); Mx = data ( : , 4); My = data ( : , 5) ; Mz = data ( : , 6 ) ; Calculate the COPx and COPy of this data using the function your wrote in Step 1. [copx copy]=calcCOP (Fx, Fy , Fz, Mx , My, Mz): COP(y) = A good way to visualize this data is to plot the center of pressure in the y direction versus the center of pressure in the x direction. In other words, plot the (x,y) coordinates of the COP in the x-y plane for each time point. This can be done with the scatter command. scatter (copx, copy) Part 2 Determine which classmate had the best balance. You will use the function file written in Part 1. You will write a script file to process all 32 balance datasets. The script file should perform the following steps. Matlab processing of the balance lab data: Part 1 Write a Matlab function to calculate the center of pressure (COP) in the x and y directions from the force plate measurements Step l: Write a Matlab Function The input to your function will be six vectors corresponding to the three forces and three moments measured by the force plate. - The output of your function will be COPx and coPy, the center of pressure in the x and y directions, respectively. Therefore, the first line of your function file will look something like this. function [COPX , COPy] = calcCOP(fx, fy, fz, mz) mx , my, The equations for calculating COPx and COPy are below. Zoffset-102 mm for the AMTI Force Plate. (myTeoffset.Fx)))*(-1) (Mxt(Zoffset )) COP(x) = Step 2: Test your Matlab function by reading in one of the balance data files. data-load ( 'Balance\Balancel.txt) Extract the relevant variables from the data file Fx = data ( : , 1) ; Fy- data ( : , 2 ) ; Fz -data ( : , 3); Mx = data ( : , 4); My = data ( : , 5) ; Mz = data ( : , 6 ) ; Calculate the COPx and COPy of this data using the function your wrote in Step 1. [copx copy]=calcCOP (Fx, Fy , Fz, Mx , My, Mz): COP(y) = A good way to visualize this data is to plot the center of pressure in the y direction versus the center of pressure in the x direction. In other words, plot the (x,y) coordinates of the COP in the x-y plane for each time point. This can be done with the scatter command. scatter (copx, copy) Part 2 Determine which classmate had the best balance. You will use the function file written in Part 1. You will write a script file to process all 32 balance datasets. The script file should perform the following steps


