Answered step by step
Verified Expert Solution
Question
1 Approved Answer
https://www.kaggle.com/datasets/pavan9065/top-100-most-streamed-songs-on-spotify?resource=download Link above: that's my data I chose. Introduction First summarize the purpose of the report and the data being analyzed. Then summarize the questions
 https://www.kaggle.com/datasets/pavan9065/top-100-most-streamed-songs-on-spotify?resource=download
Link above: that's my data I chose.
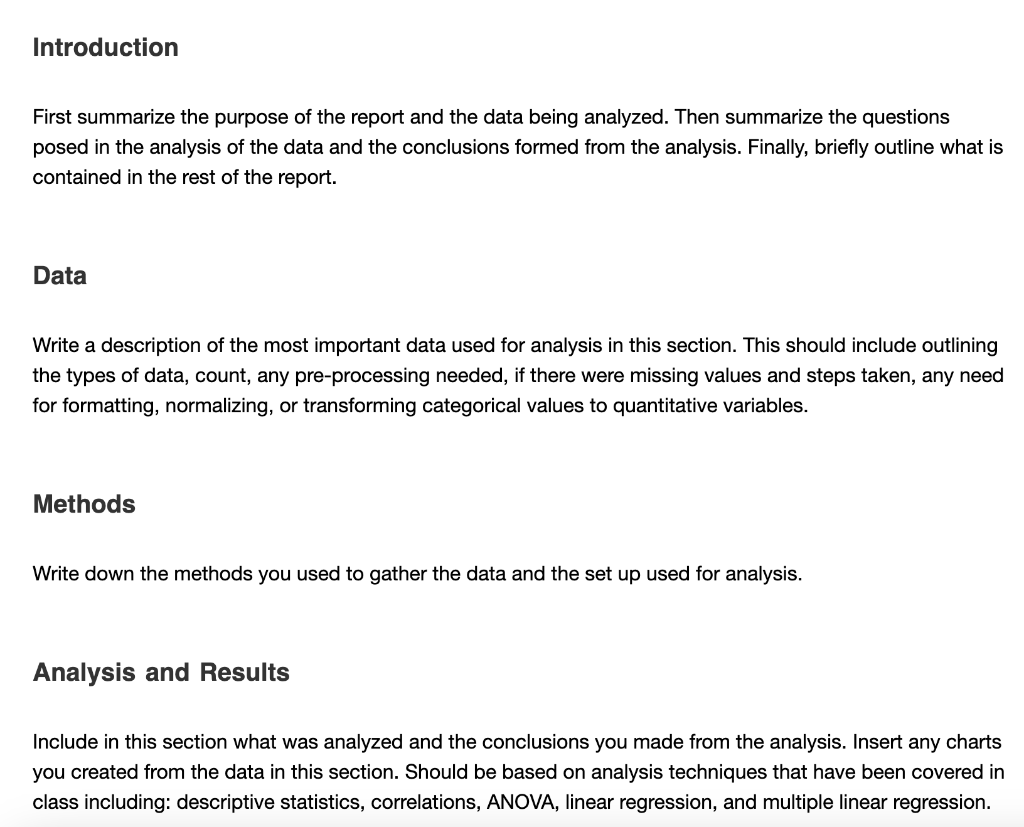
Introduction First summarize the purpose of the report and the data being analyzed. Then summarize the questions posed in the analysis of the data and the conclusions formed from the analysis. Finally, briefly outline what is contained in the rest of the report. Data Write a description of the most important data used for analysis in this section. This should include outlining the types of data, count, any pre-processing needed, if there were missing values and steps taken, any need for formatting, normalizing, or transforming categorical values to quantitative variables. Methods Write down the methods you used to gather the data and the set up used for analysis. Analysis and Results Include in this section what was analyzed and the conclusions you made from the analysis. Insert any charts you created from the data in this section. Should be based on analysis techniques that have been covered in class including: descriptive statistics, correlations, ANOVA, linear regression, and multiple linear regressionStep by Step Solution
There are 3 Steps involved in it
Step: 1

Get Instant Access to Expert-Tailored Solutions
See step-by-step solutions with expert insights and AI powered tools for academic success
Step: 2

Step: 3

Ace Your Homework with AI
Get the answers you need in no time with our AI-driven, step-by-step assistance
Get Started


