

Answered step by step
Verified Expert Solution
Question
1 Approved Answer
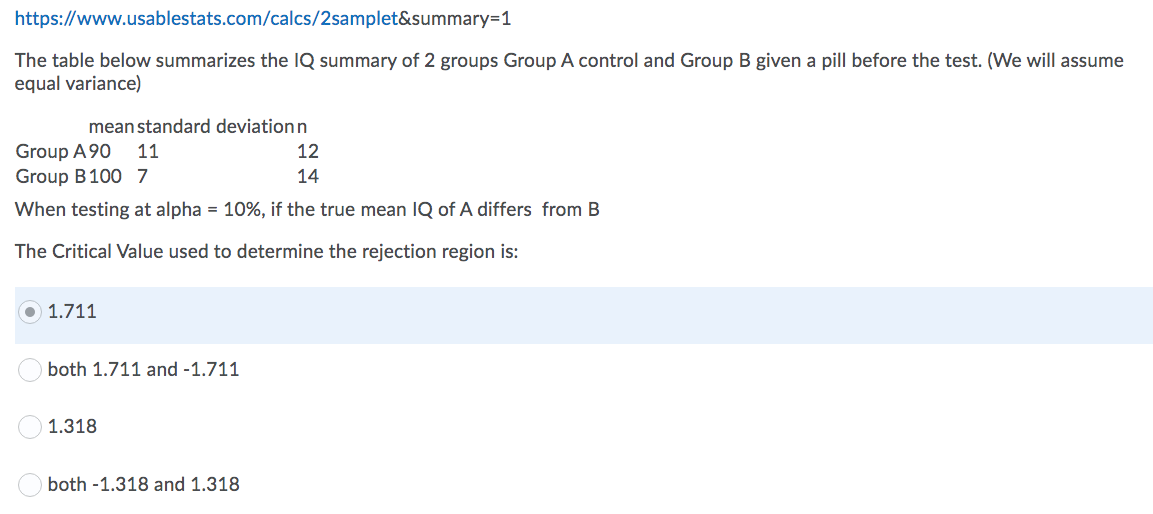
https://www.usablestats.com/calcs/2samplet&summary=1 The table below summarizes the IQ summary of 2 groups Group A control and Group B given a pill before the test. (We will
Step by Step Solution
There are 3 Steps involved in it
Step: 1

Get Instant Access to Expert-Tailored Solutions
See step-by-step solutions with expert insights and AI powered tools for academic success
Step: 2

Step: 3
Ace Your Homework with AI
Get the answers you need in no time with our AI-driven, step-by-step assistance
Get Started
Linear Algebra With Applications
Authors: Gareth Williams
7th Edition
0763790923, 9780763790929