HW 01 (due by June 22) Start Assignment Due Jun 22 by 11:59pm Points 9 Submitting a file upload File Types html Q1 (3 pts).
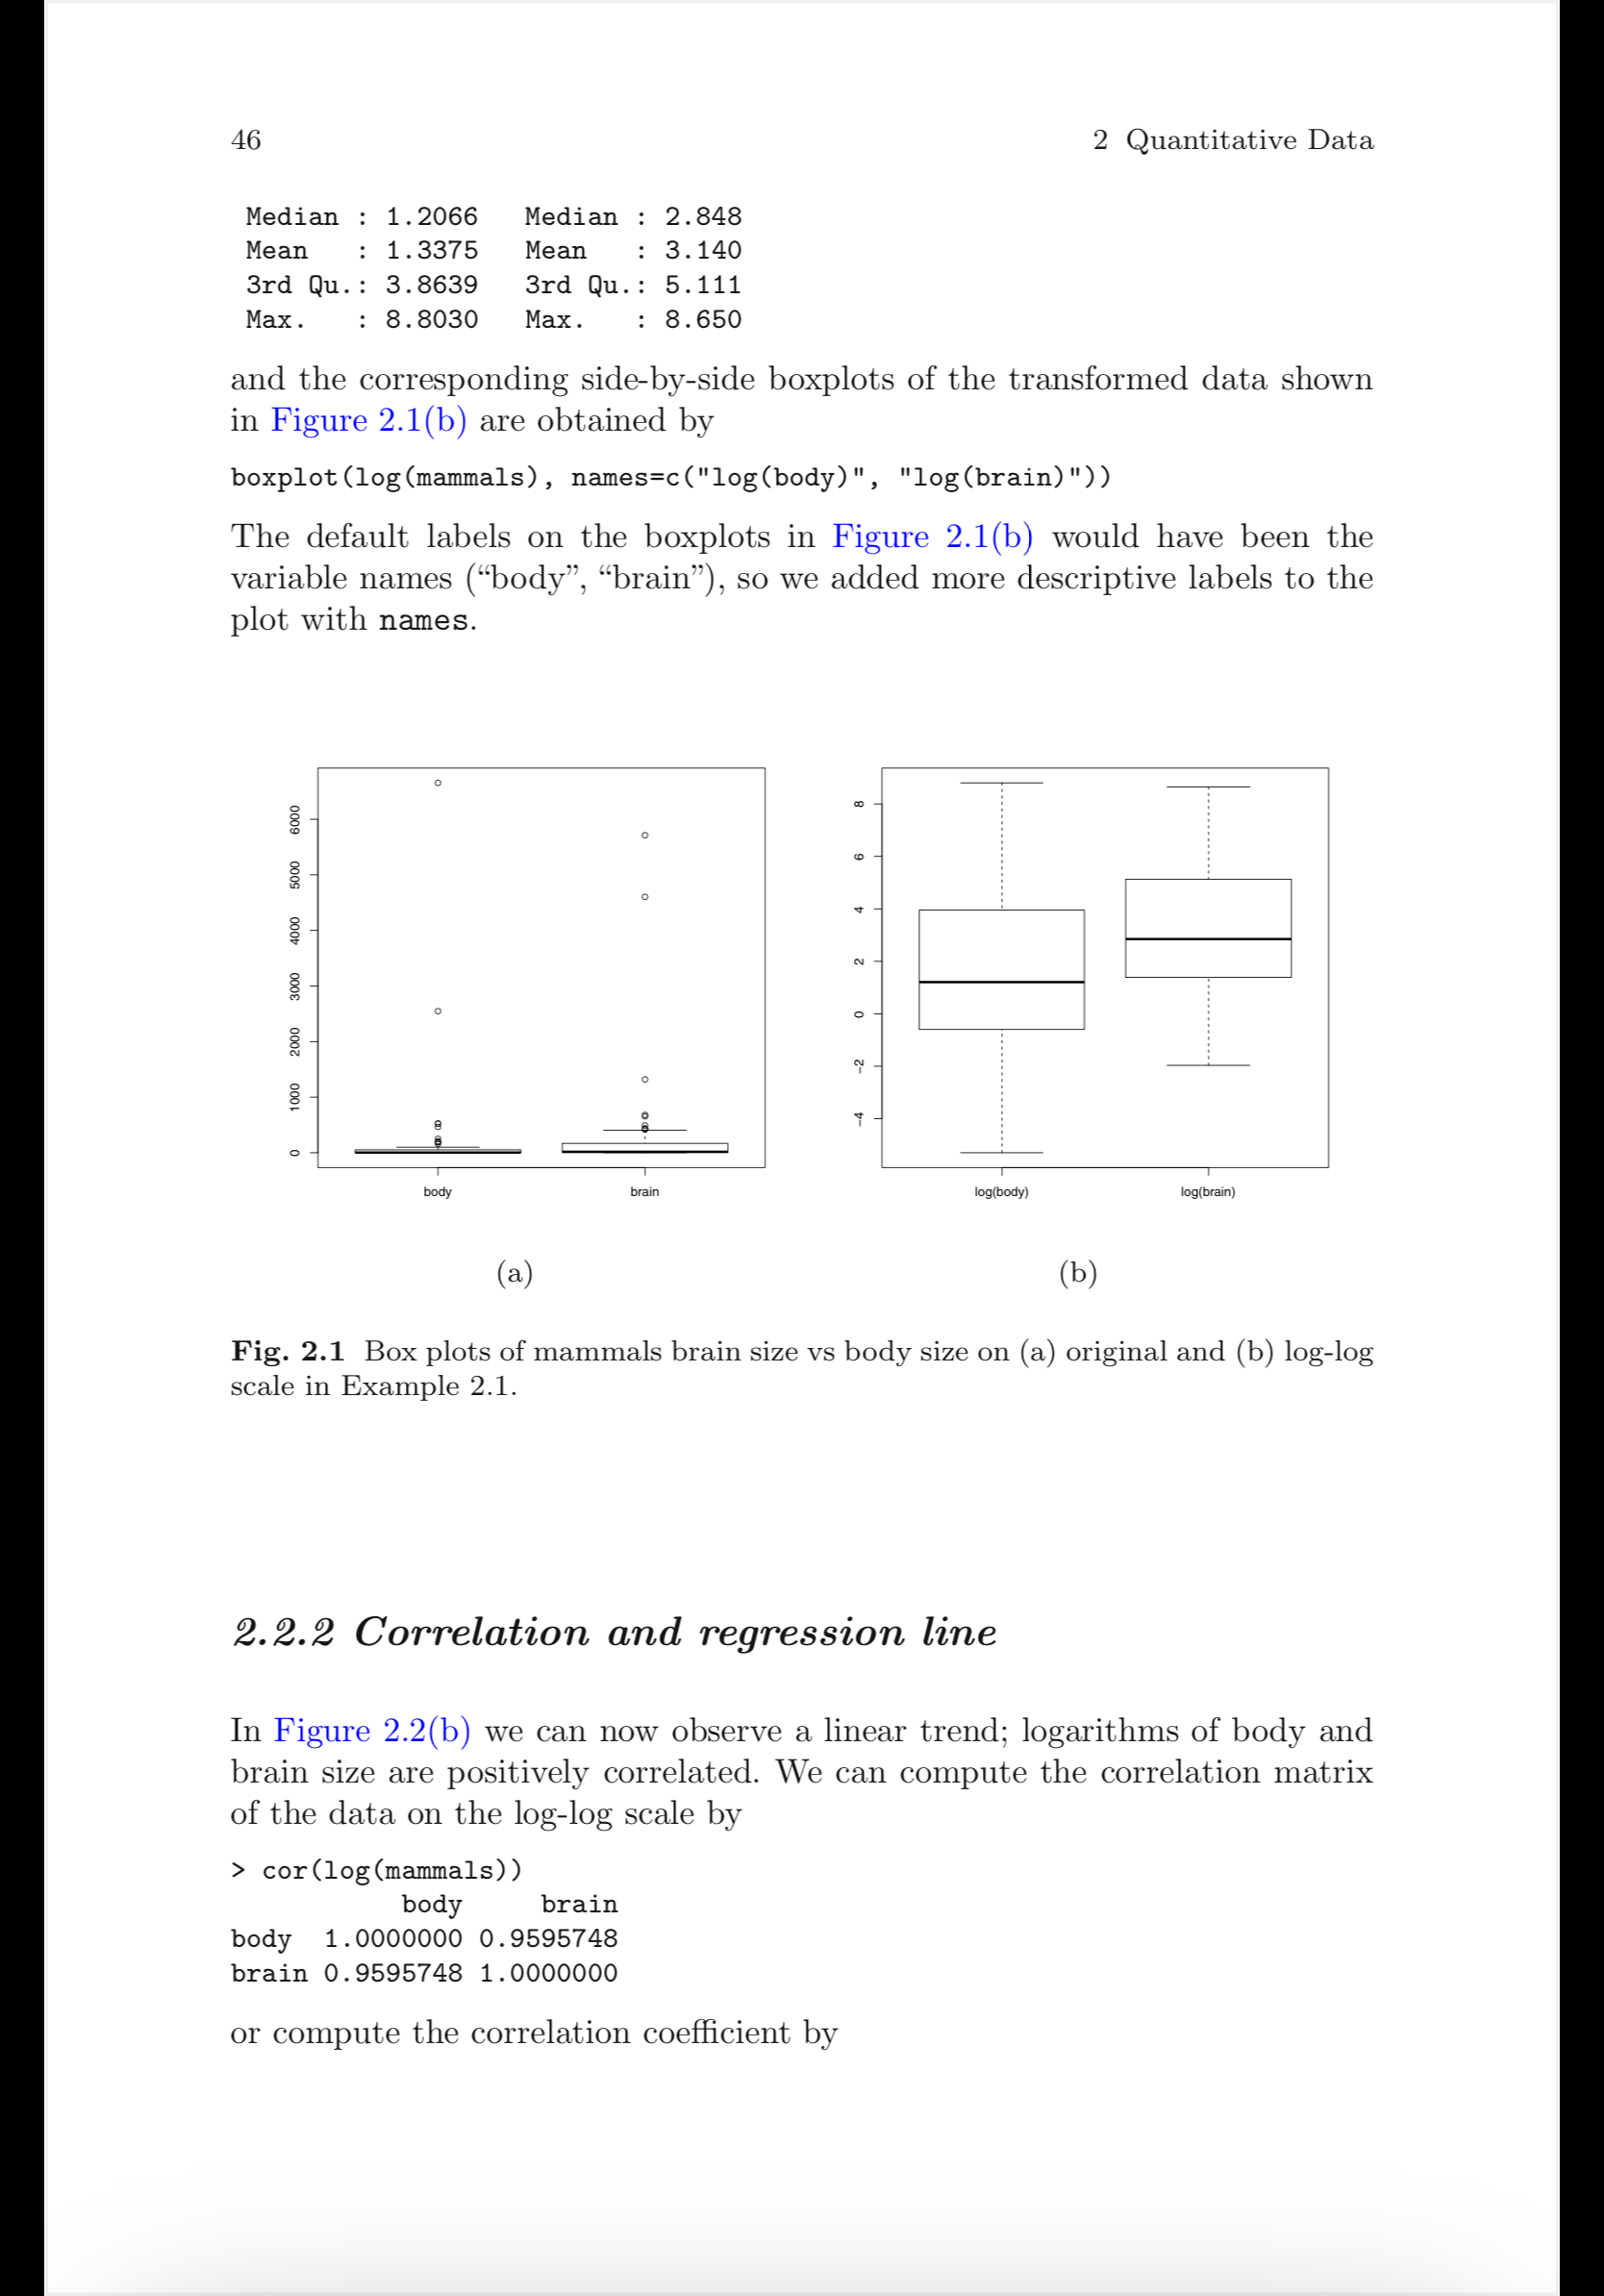
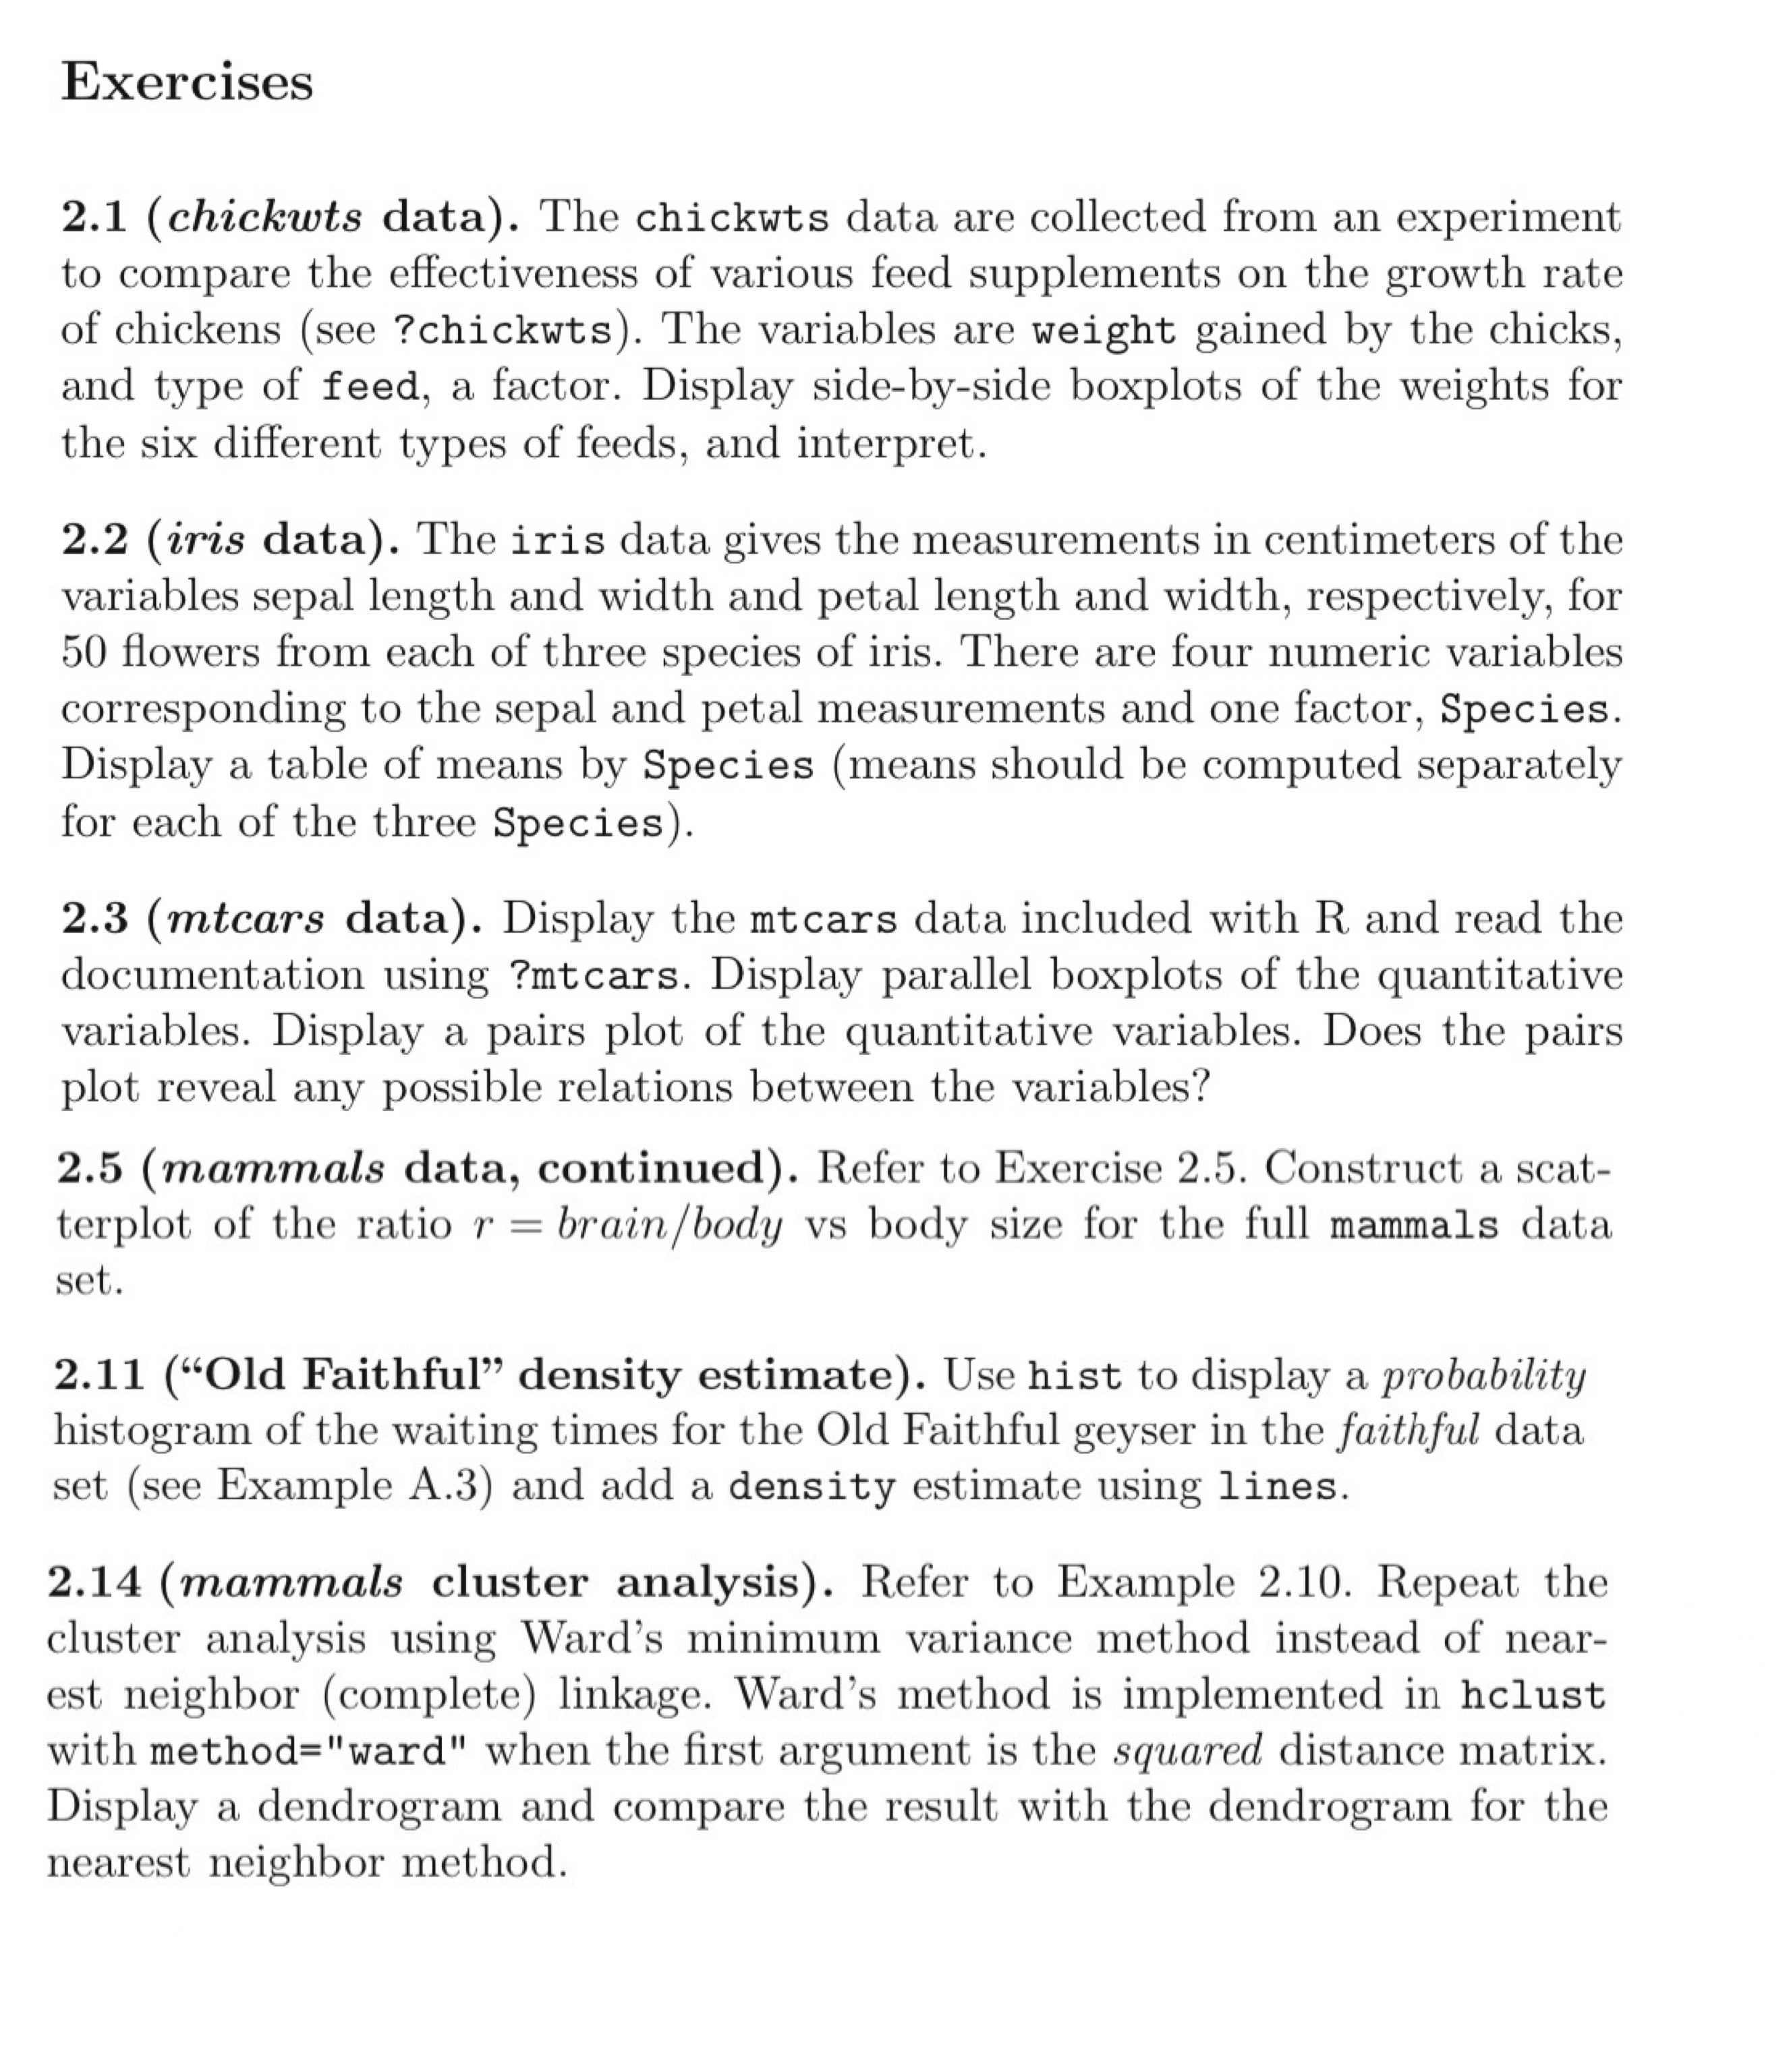
HW 01 (due by June 22) Start Assignment Due Jun 22 by 11:59pm Points 9 Submitting a file upload File Types html Q1 (3 pts). (Self-reporting). Complete the following sections from Albert and Rizzo: 2.1, 2.2, 2.3, 2.5. You simply have to indicate if you have completed it (you can indicate this in the space where you add comments). Q2 (3 pts). Albert and Rizzo. Exercise 2.11 (at the end of chap. 2). On Old Faithful histogram. Q3 (3 pts). Albert and Rizzo. Exercise 2.14 (mammals cluster analysis). Format for Q2 and Q3: . Create html files from your R Notebook. Submit the html files (don't submit the R script files or R markdown files). Google "how to use convert R notebook to html file." . Be sure to add brief descriptions or documentations for each question (explain your thoughts and work).46 2 Quantitative Data Median : 1.2066 Median : 2.848 Mean : 1.3375 Mean : 3.140 3rd Qu.: 3.8639 3rd. (hi. & 5.111 Max . : 8.8030 Max. : 8.650 and the corresponding side-by-side boxplots of the transformed data shown in Figure 2.1(b) are obtained by boxplot (log(mammals), names=c("log(body)", "log(brain)")) The default labels on the boxplots in Figure 2.1(b) would have been the variable names (\"body\Exercises 2.1 (chickwts data). The chickwts data are collected from an experiment to compare the effectiveness of various feed supplements on the growth rate of chickens (see ?chickwts). The variables are weight gained by the chicks, and type of feed, a factor. Display side-by-side boxplots of the weights for the six different types of feeds, and interpret. 2.2 (iris data). The iris data gives the measurements in centimeters of the variables sepal length and width and petal length and width, respectively, for 50 flowers from each of three species of iris. There are four numeric variables corresponding to the sepal and petal measurements and one factor, Species. Display a table of means by Species (means should be computed separately for each of the three Species). 2.3 (mtcars data). Display the mtcars data included with R and read the documentation using ?mtcars. Display parallel boxplots of the quantitative variables. Display a pairs plot of the quantitative variables. Does the pairs plot reveal any possible relations between the variables? 2.5 (mammals data, continued). Refer to Exercise 2.5. Construct a scat- terplot of the ratio r = brain/body vs body size for the full mammals data set. 2.11 (\"Old Faithful\" density estimate). Use hist to display a probability histogram of the waiting times for the Old Faithful geyser in the faithful data set (see Example A.3) and add a density estimate using lines. 2.14 (mammals cluster analysis). Refer to Example 2.10. Repeat the cluster analysis using Ward's minimum variance method instead of near- est neighbor (complete) linkage. Ward's method is implemented in hclust with method="ward" when the first argument is the squared distance matrix. Display a dendrogram and compare the result with the dendrogram for the nearest neighbor method
Step by Step Solution
There are 3 Steps involved in it
Step: 1
Get Instant Access to Expert-Tailored Solutions
See step-by-step solutions with expert insights and AI powered tools for academic success
Step: 2
Step: 3
Ace Your Homework with AI
Get the answers you need in no time with our AI-driven, step-by-step assistance