Answered step by step
Verified Expert Solution
Question
1 Approved Answer
HW #2: DCF: FCFF Started: Mar 6 at 2:02pm Quiz Instructions Over the next three years (2020, 2021, and 2022), Dollar Tree is projecting
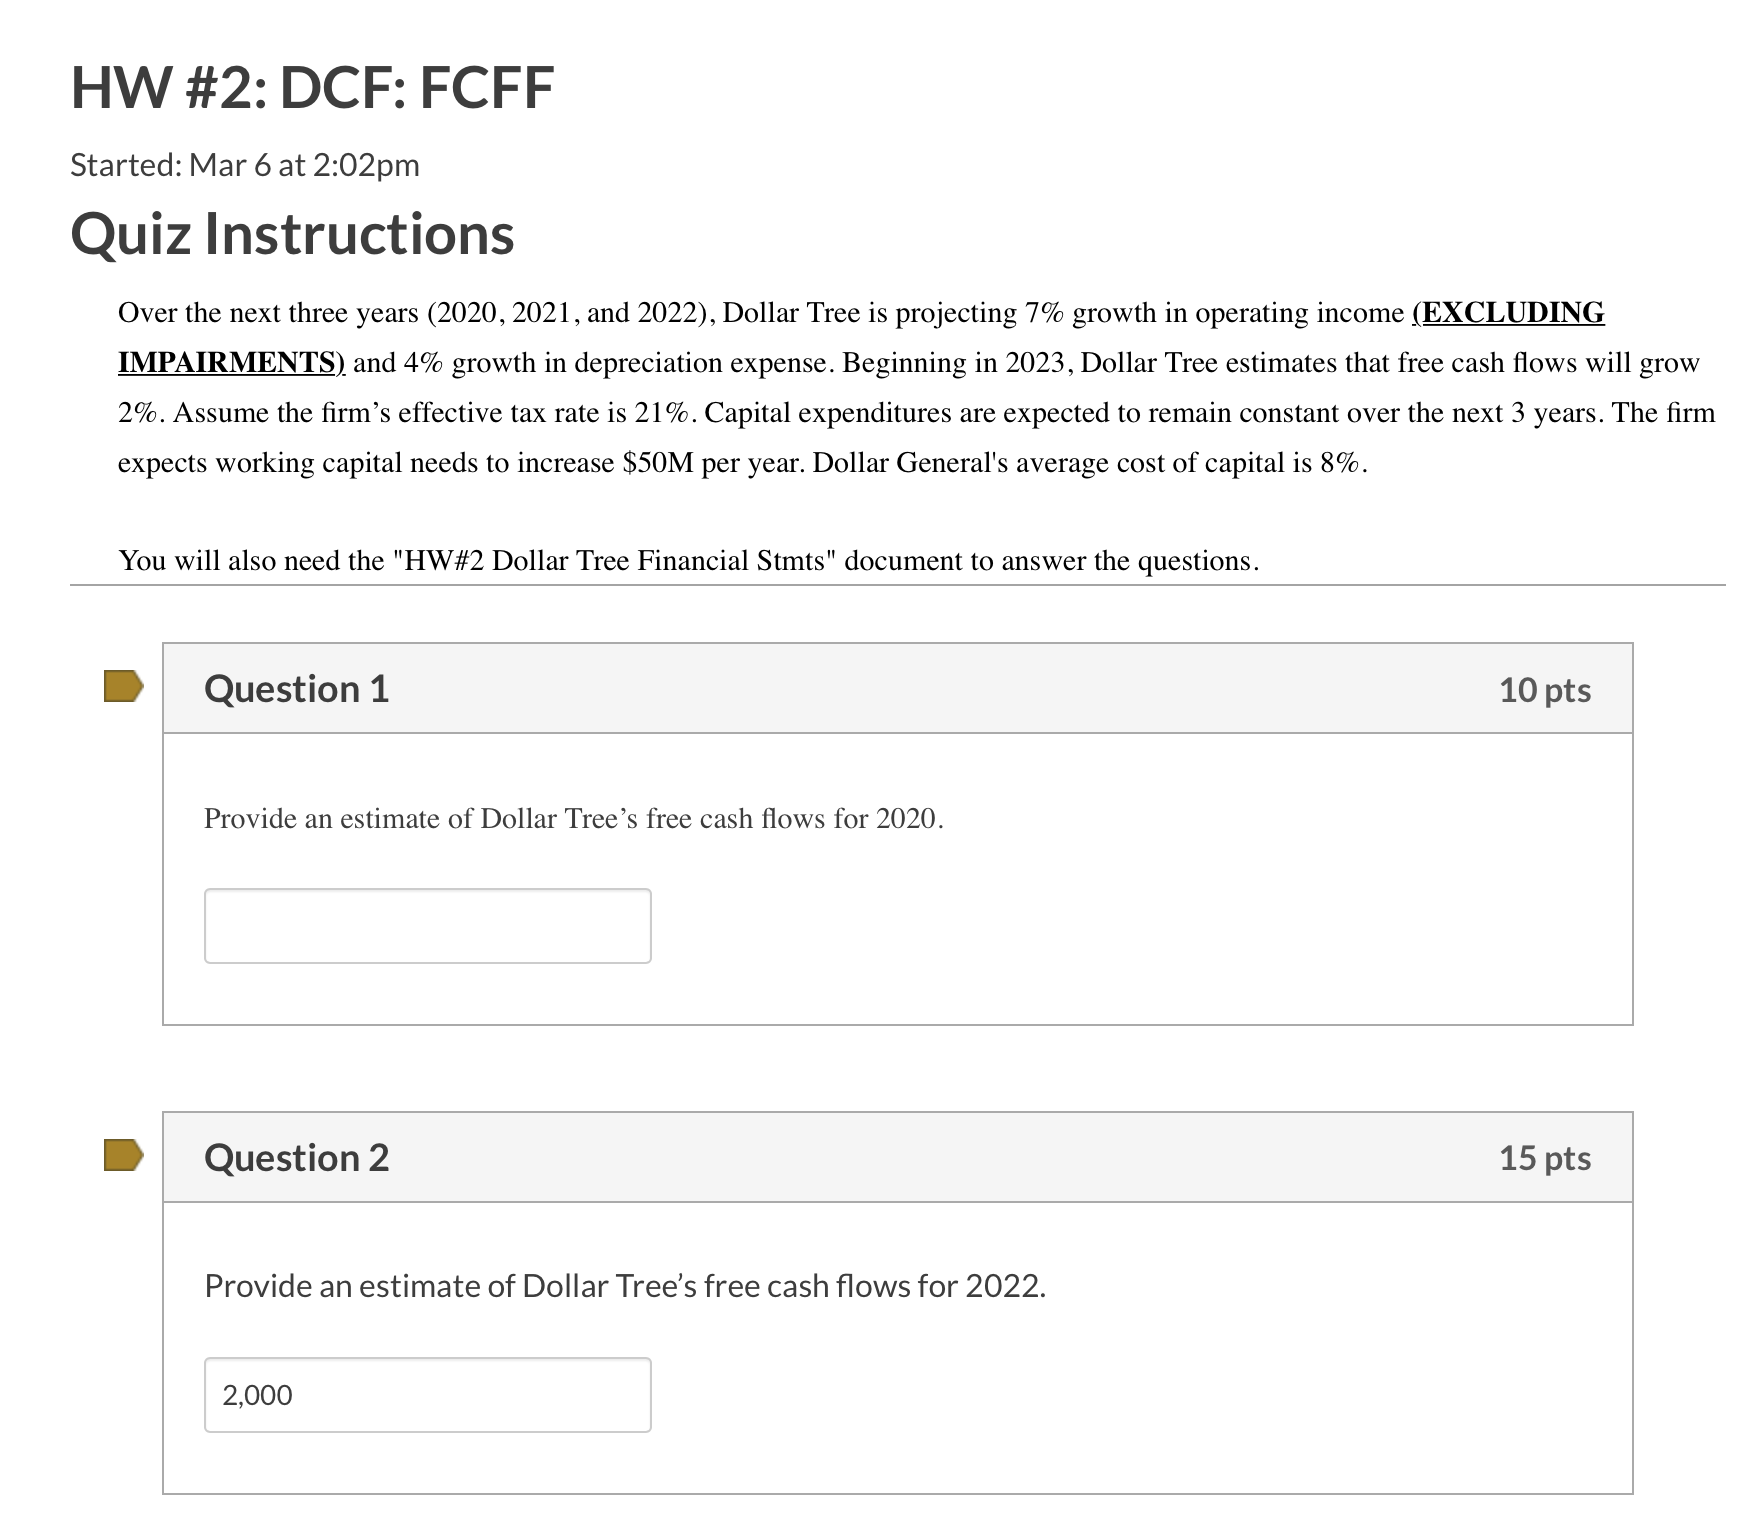
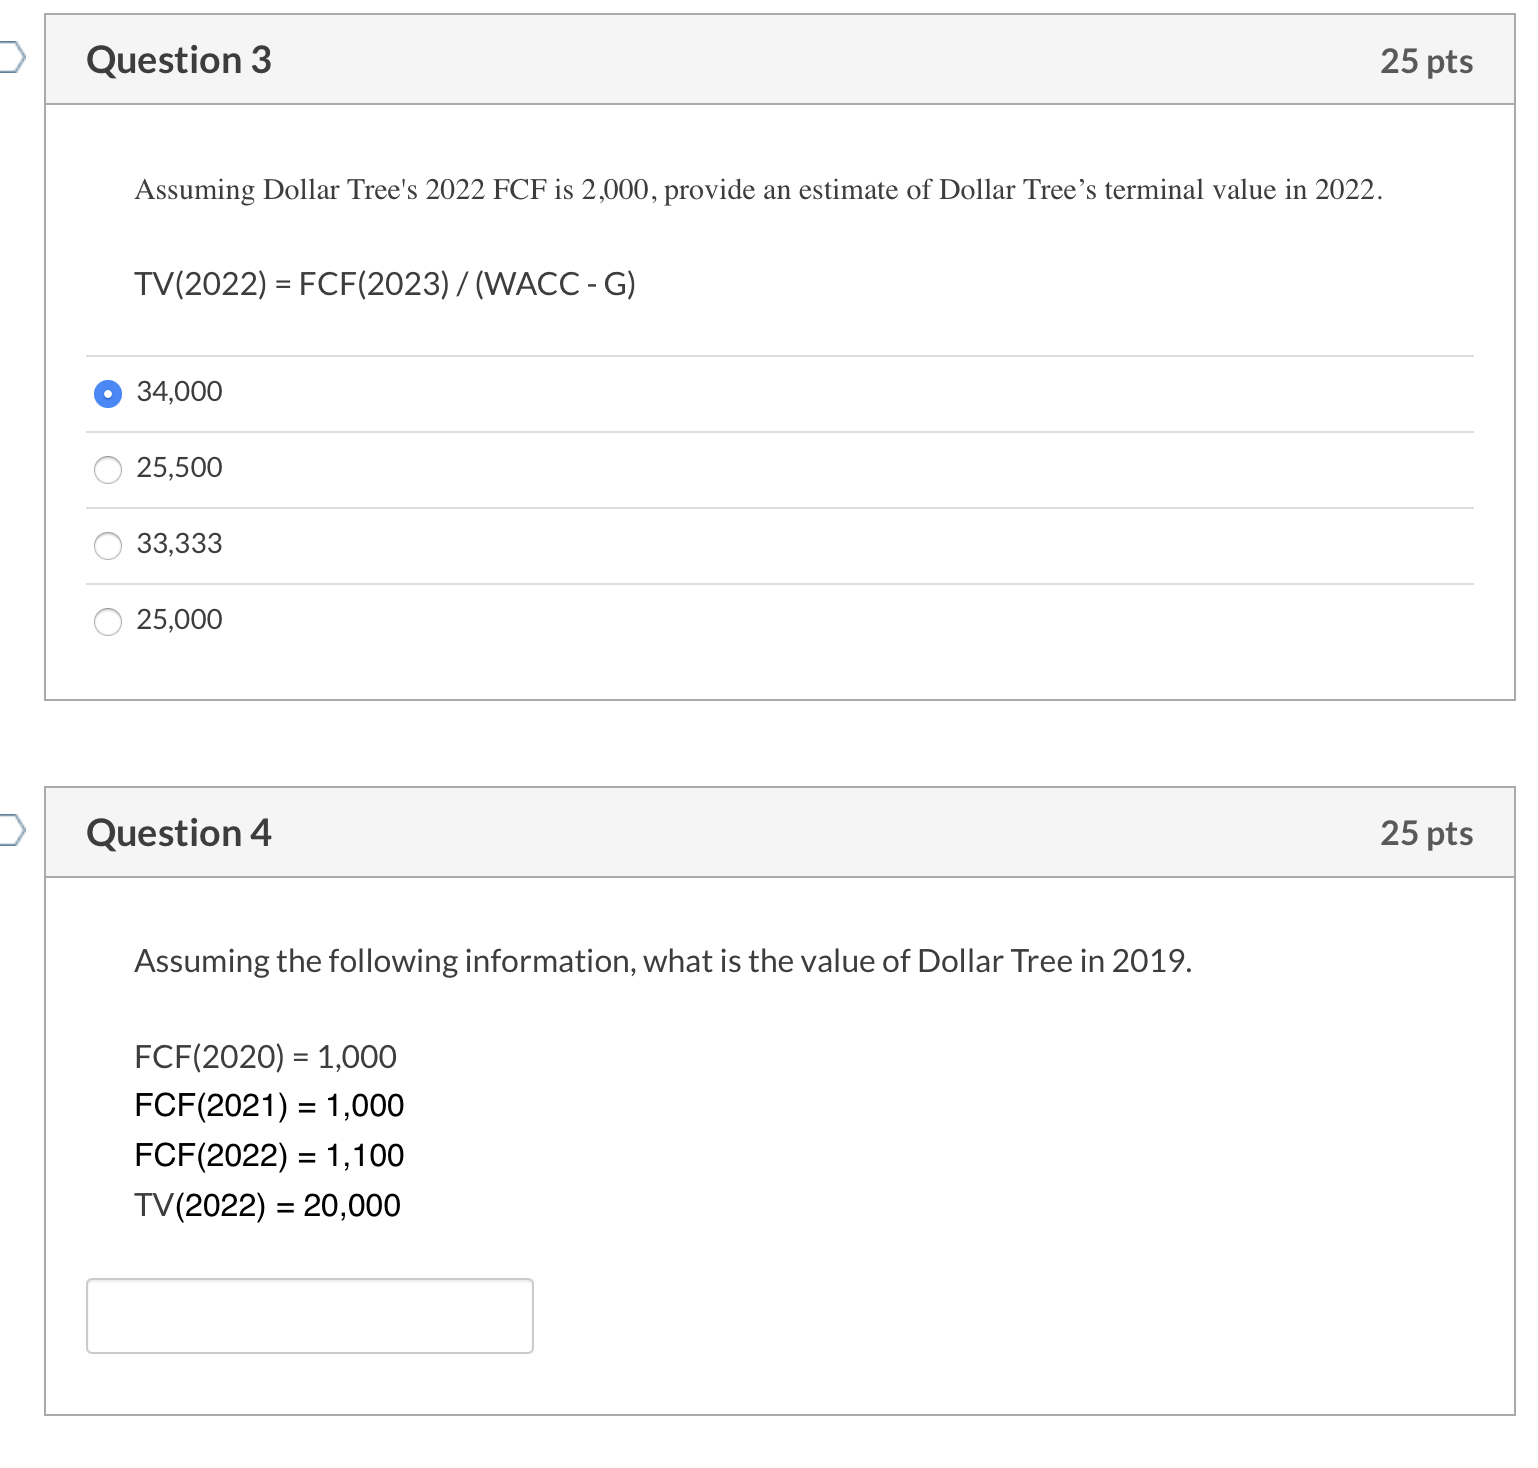
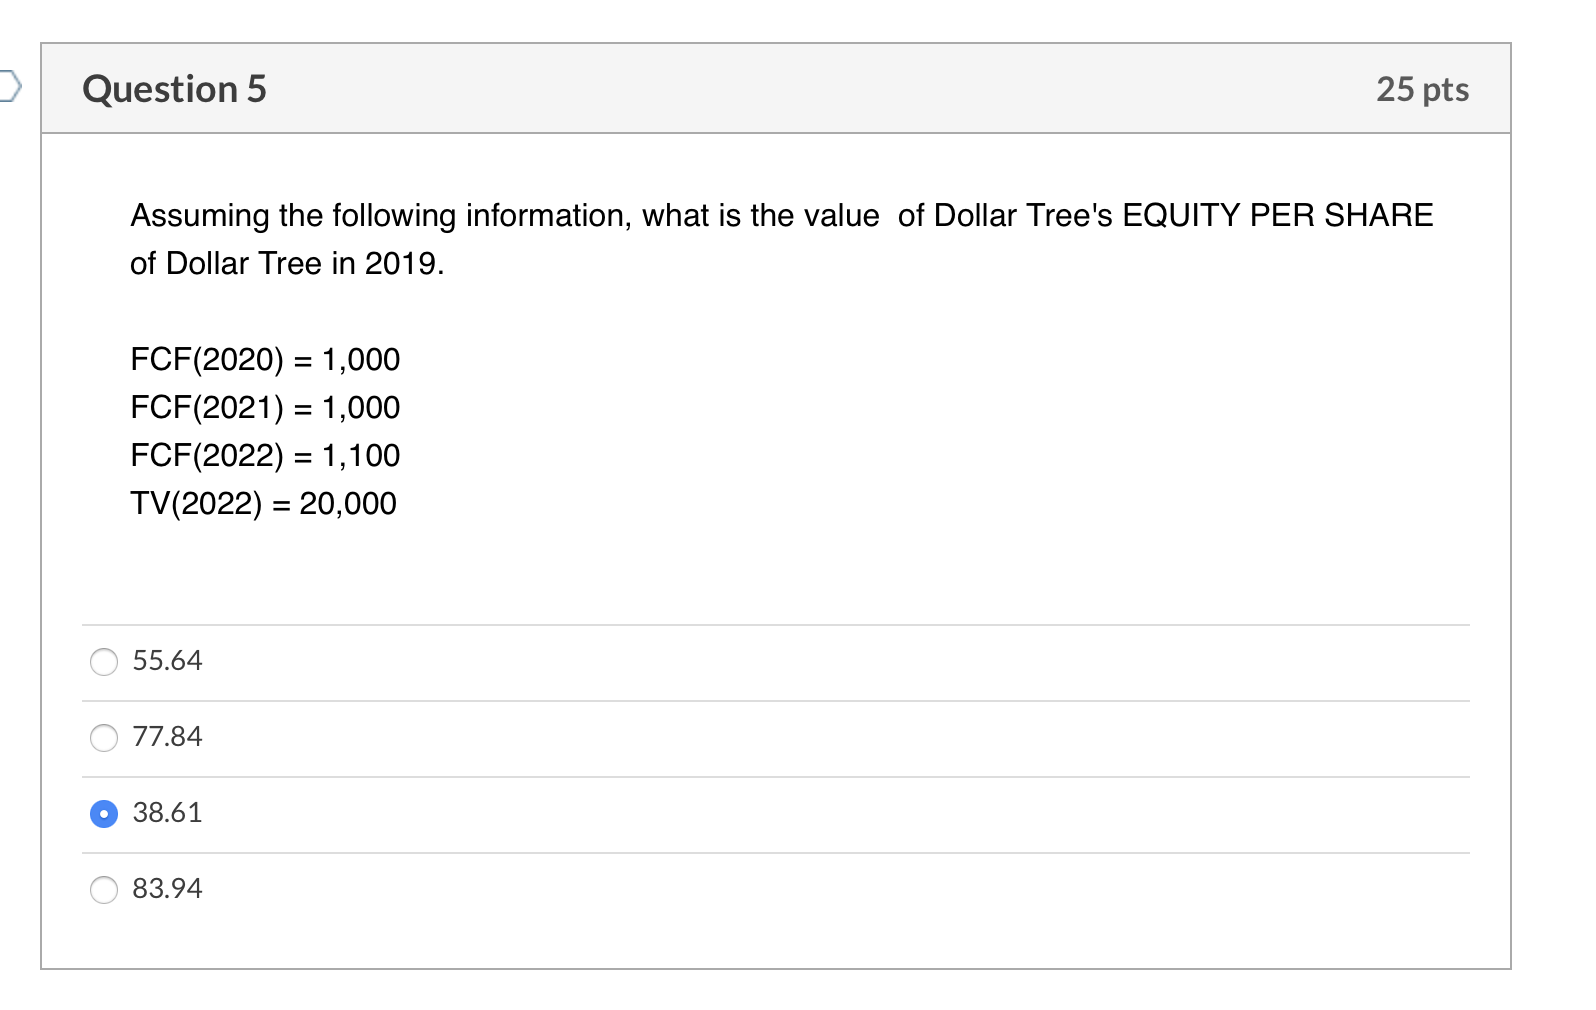
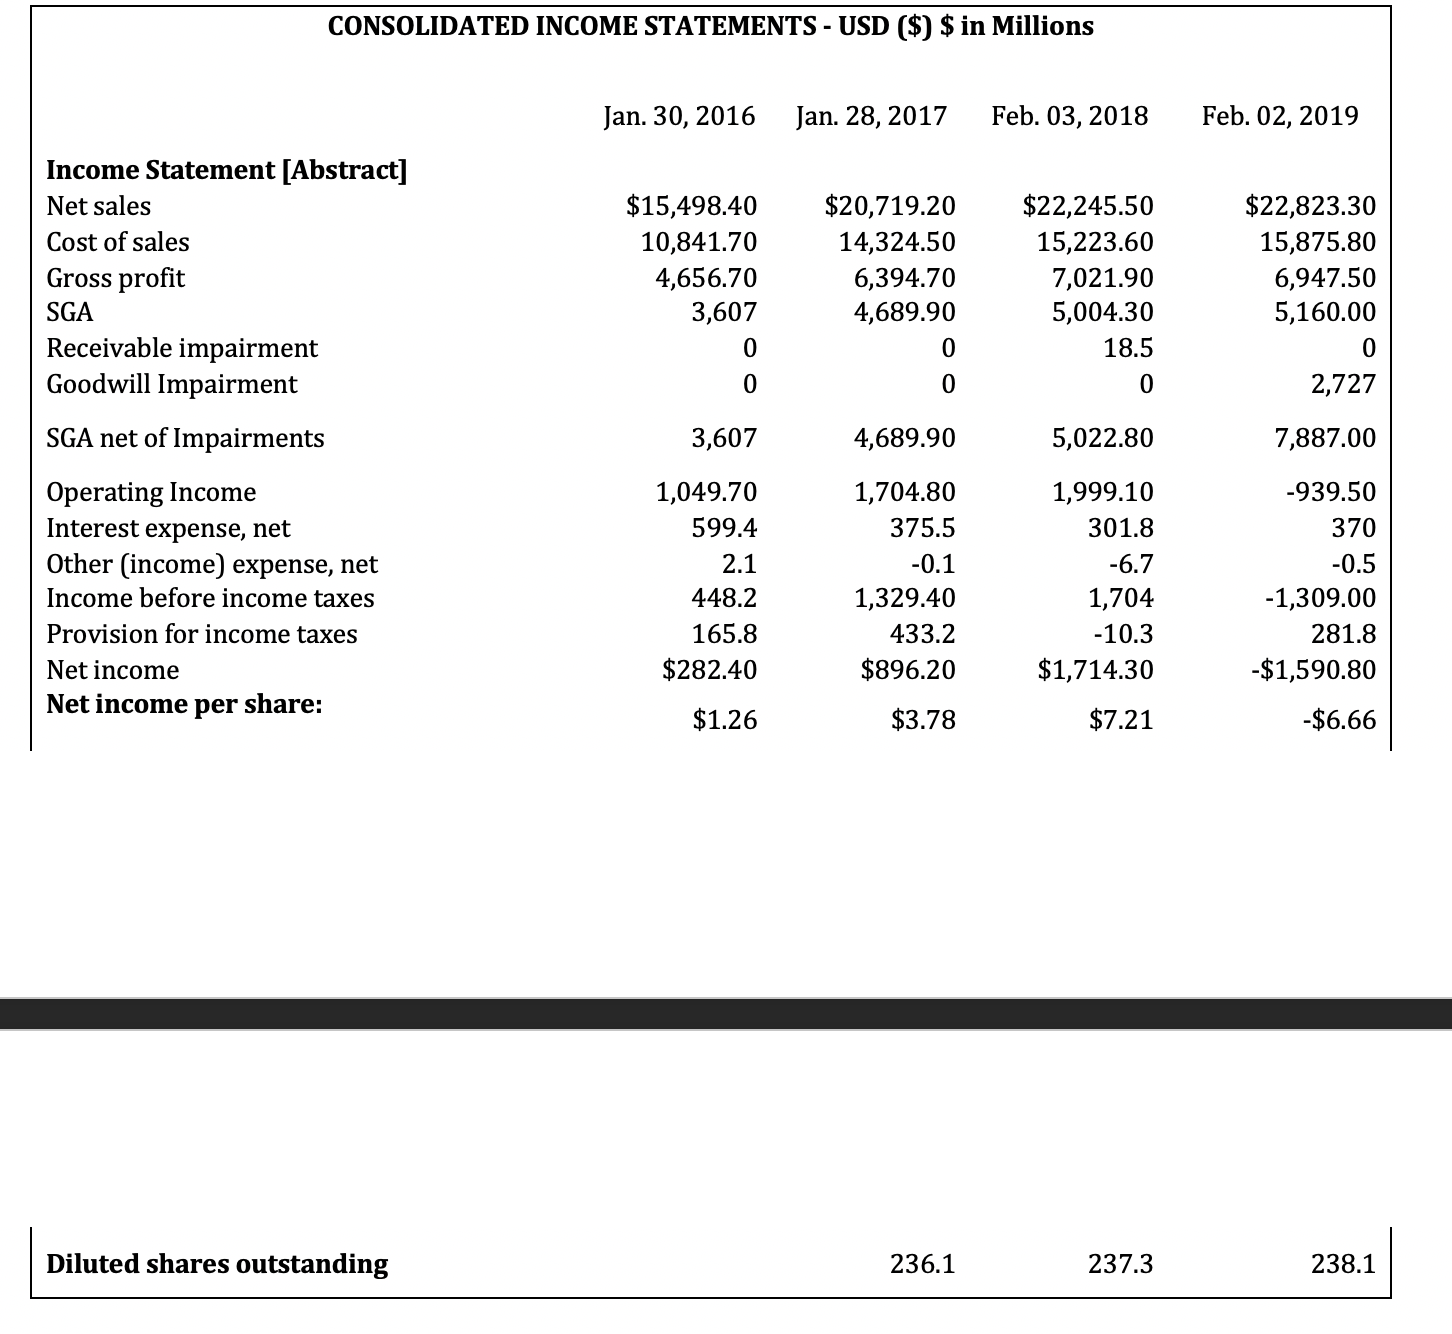
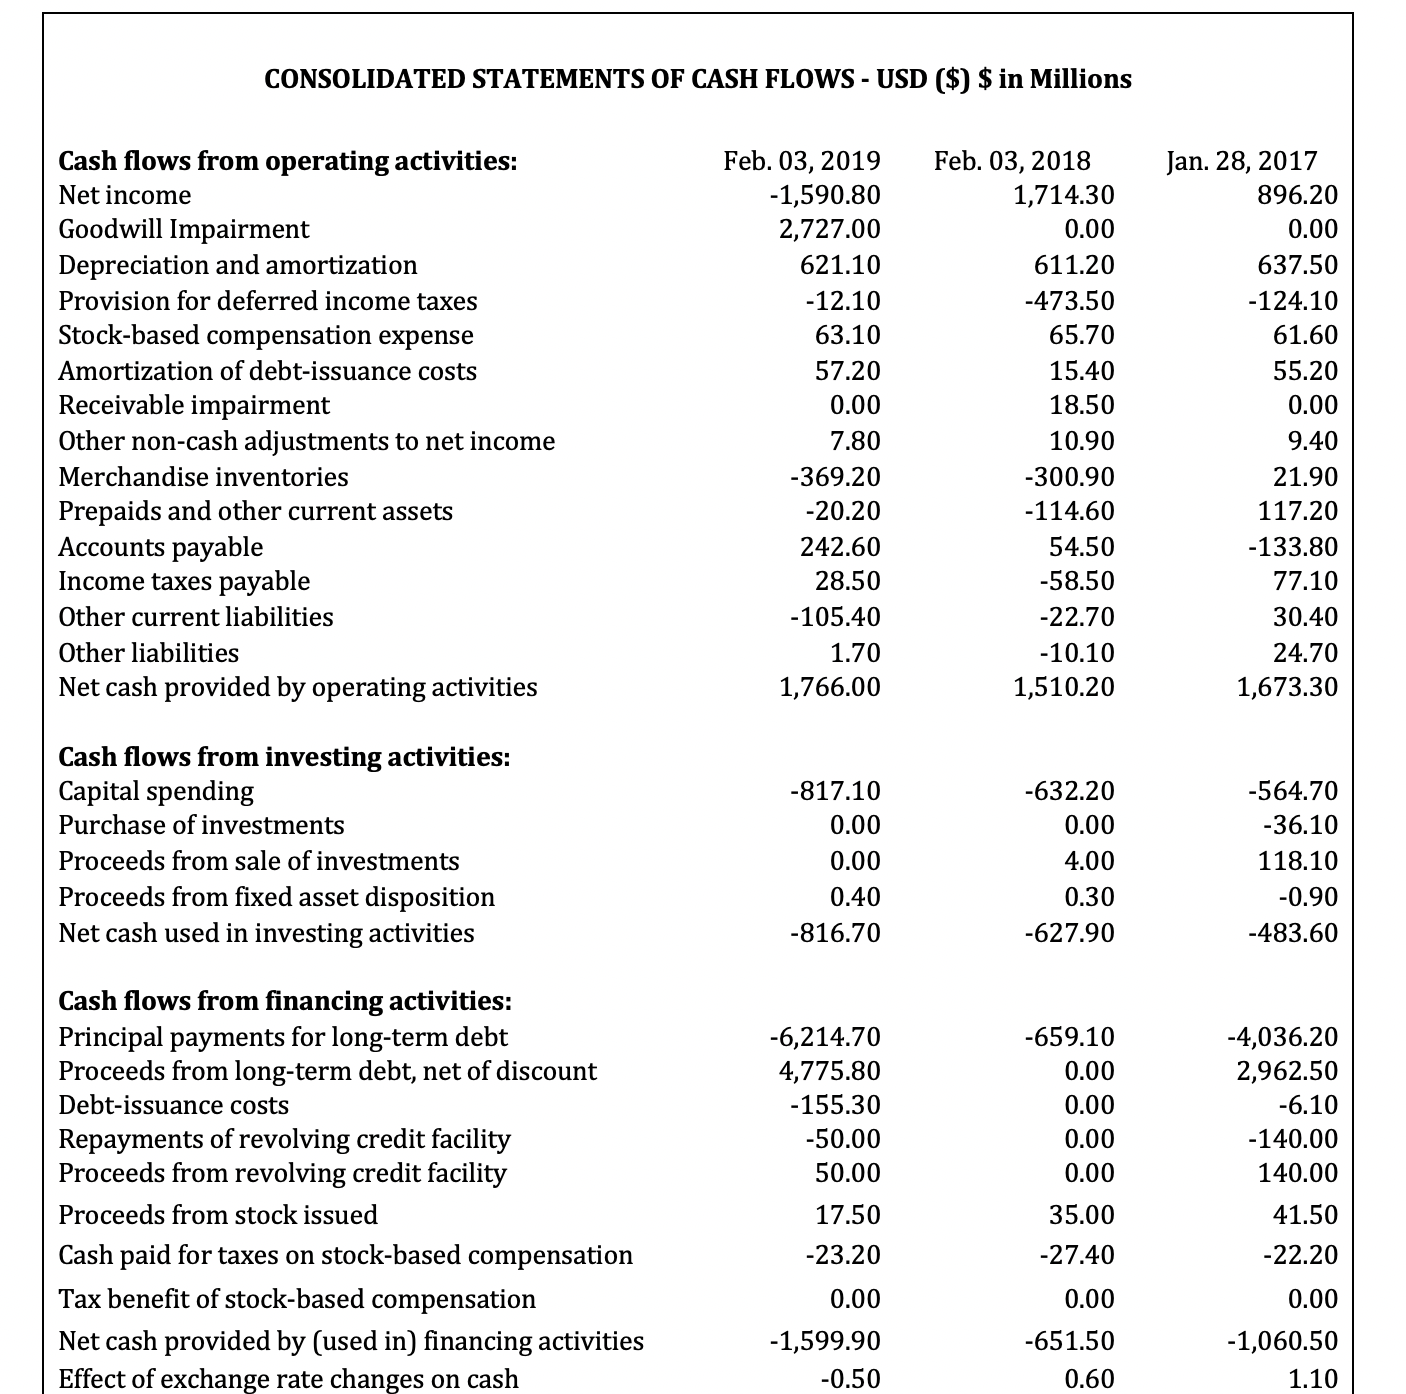
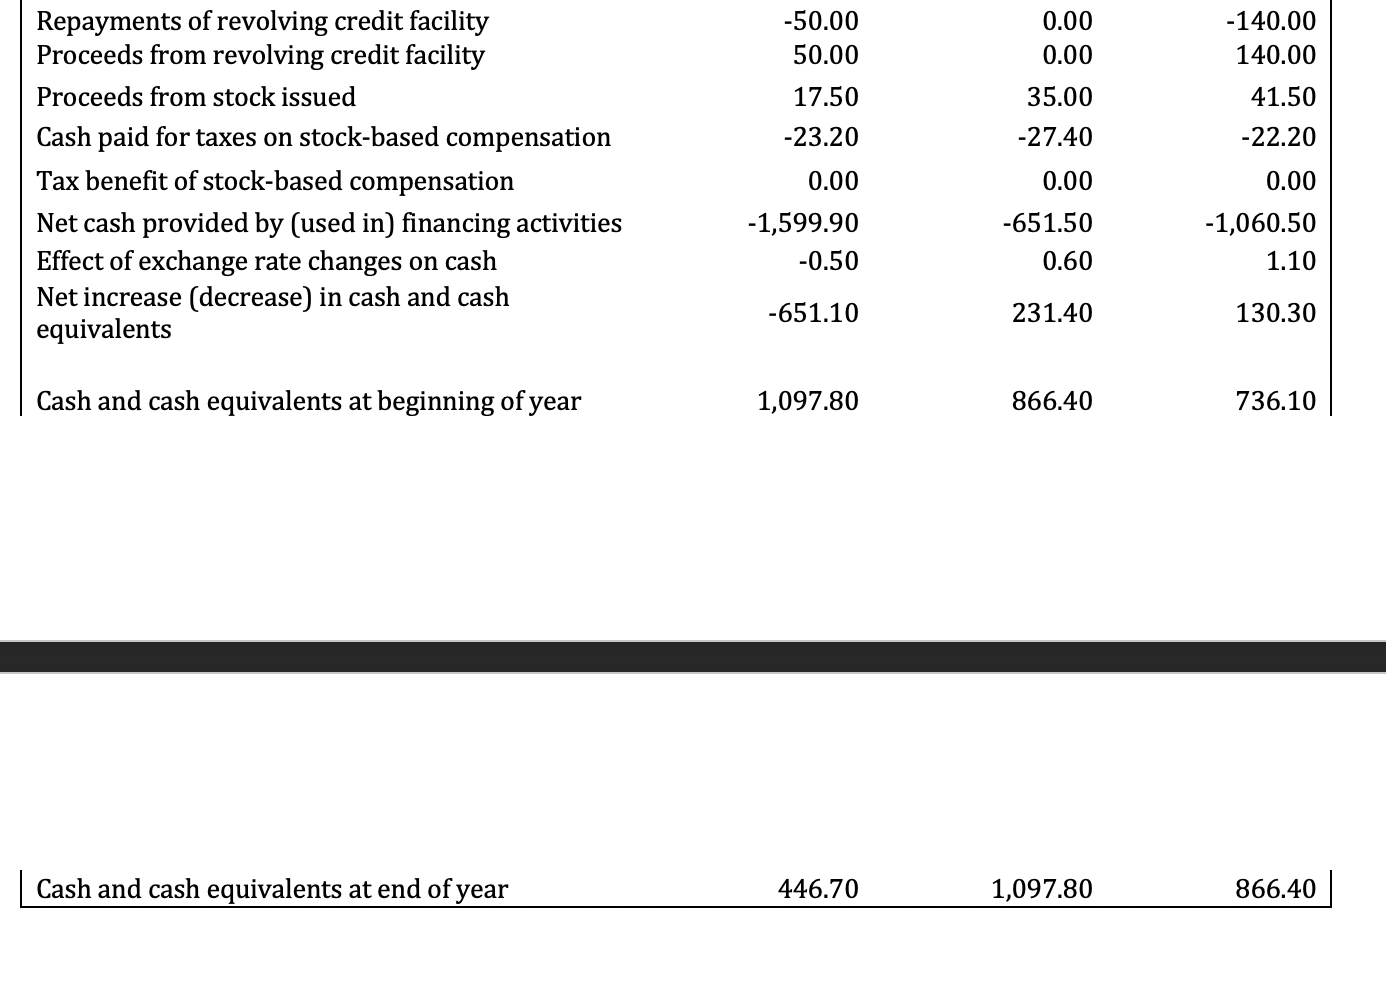
HW #2: DCF: FCFF Started: Mar 6 at 2:02pm Quiz Instructions Over the next three years (2020, 2021, and 2022), Dollar Tree is projecting 7% growth in operating income (EXCLUDING IMPAIRMENTS) and 4% growth in depreciation expense. Beginning in 2023, Dollar Tree estimates that free cash flows will grow 2%. Assume the firm's effective tax rate is 21%. Capital expenditures are expected to remain constant over the next 3 years. The firm expects working capital needs to increase $50M per year. Dollar General's average cost of capital is 8%. You will also need the "HW#2 Dollar Tree Financial Stmts" document to answer the questions. Question 1 Provide an estimate of Dollar Tree's free cash flows for 2020. Question 2 Provide an estimate of Dollar Tree's free cash flows for 2022. 2,000 10 pts 15 pts > Question 3 Assuming Dollar Tree's 2022 FCF is 2,000, provide an estimate of Dollar Tree's terminal value in 2022. TV(2022) FCF(2023)/(WACC - G) 34,000 25,500 33,333 25,000 Question 4 Assuming the following information, what is the value of Dollar Tree in 2019. FCF(2020) 1,000 = FCF(2021) = 1,000 FCF(2022) = 1,100 TV(2022) 20,000 = 25 pts 25 pts > Question 5 25 pts Assuming the following information, what is the value of Dollar Tree's EQUITY PER SHARE of Dollar Tree in 2019. FCF(2020) = 1,000 FCF(2021) = 1,000 FCF(2022) = 1,100 TV(2022) 20,000 = 55.64 77.84 38.61 83.94 CONSOLIDATED INCOME STATEMENTS - USD ($) $ in Millions Jan. 30, 2016 Jan. 28, 2017 Feb. 03, 2018 Feb. 02, 2019 Income Statement [Abstract] Net sales Cost of sales Gross profit SGA Receivable impairment Goodwill Impairment $15,498.40 $20,719.20 $22,245.50 $22,823.30 10,841.70 14,324.50 15,223.60 15,875.80 4,656.70 6,394.70 7,021.90 6,947.50 3,607 4,689.90 5,004.30 5,160.00 0 0 18.5 0 0 0 0 2,727 SGA net of Impairments 3,607 4,689.90 5,022.80 7,887.00 Operating Income 1,049.70 1,704.80 1,999.10 -939.50 Interest expense, net 599.4 375.5 301.8 370 Other (income) expense, net 2.1 -0.1 -6.7 -0.5 Income before income taxes 448.2 1,329.40 1,704 -1,309.00 Provision for income taxes 165.8 433.2 -10.3 Net income Net income per share: $282.40 $896.20 $1,714.30 281.8 -$1,590.80 $1.26 $3.78 $7.21 -$6.66 Diluted shares outstanding 236.1 237.3 238.1 CONSOLIDATED STATEMENTS OF CASH FLOWS - USD ($) $ in Millions Cash flows from operating activities: Feb. 03, 2019 Net income Goodwill Impairment -1,590.80 Feb. 03, 2018 1,714.30 Jan. 28, 2017 896.20 2,727.00 0.00 0.00 Depreciation and amortization 621.10 611.20 637.50 Provision for deferred income taxes -12.10 -473.50 -124.10 Stock-based compensation expense 63.10 65.70 61.60 Amortization of debt-issuance costs 57.20 15.40 55.20 Receivable impairment 0.00 18.50 0.00 Other non-cash adjustments to net income 7.80 10.90 9.40 Merchandise inventories -369.20 -300.90 21.90 Prepaids and other current assets -20.20 -114.60 117.20 Accounts payable 242.60 54.50 -133.80 Income taxes payable 28.50 -58.50 77.10 Other current liabilities -105.40 -22.70 30.40 Other liabilities 1.70 -10.10 24.70 Net cash provided by operating activities 1,766.00 1,510.20 1,673.30 Cash flows from investing activities: Capital spending Purchase of investments Proceeds from sale of investments Proceeds from fixed asset disposition Net cash used in investing activities -817.10 -632.20 -564.70 0.00 0.00 -36.10 0.00 4.00 118.10 0.40 0.30 -0.90 -816.70 -627.90 -483.60 Cash flows from financing activities: Principal payments for long-term debt -6,214.70 -659.10 -4,036.20 Proceeds from long-term debt, net of discount 4,775.80 0.00 2,962.50 Debt-issuance costs -155.30 0.00 -6.10 Repayments of revolving credit facility -50.00 0.00 -140.00 Proceeds from revolving credit facility 50.00 0.00 140.00 Proceeds from stock issued 17.50 35.00 41.50 Cash paid for taxes on stock-based compensation -23.20 -27.40 -22.20 Tax benefit of stock-based compensation 0.00 0.00 0.00 Net cash provided by (used in) financing activities Effect of exchange rate changes on cash -1,599.90 -651.50 -1,060.50 -0.50 0.60 1.10 Repayments of revolving credit facility Proceeds from revolving credit facility Proceeds from stock issued -50.00 0.00 -140.00 50.00 0.00 140.00 17.50 35.00 41.50 Cash paid for taxes on stock-based compensation -23.20 -27.40 -22.20 Tax benefit of stock-based compensation 0.00 0.00 0.00 Net cash provided by (used in) financing activities -1,599.90 -651.50 -1,060.50 Effect of exchange rate changes on cash -0.50 0.60 1.10 Net increase (decrease) in cash and cash equivalents -651.10 231.40 130.30 Cash and cash equivalents at beginning of year 1,097.80 866.40 736.10 Cash and cash equivalents at end of year 446.70 1,097.80 866.40
Step by Step Solution
There are 3 Steps involved in it
Step: 1

Get Instant Access to Expert-Tailored Solutions
See step-by-step solutions with expert insights and AI powered tools for academic success
Step: 2

Step: 3

Ace Your Homework with AI
Get the answers you need in no time with our AI-driven, step-by-step assistance
Get Started


