

Answered step by step
Verified Expert Solution
Question
1 Approved Answer
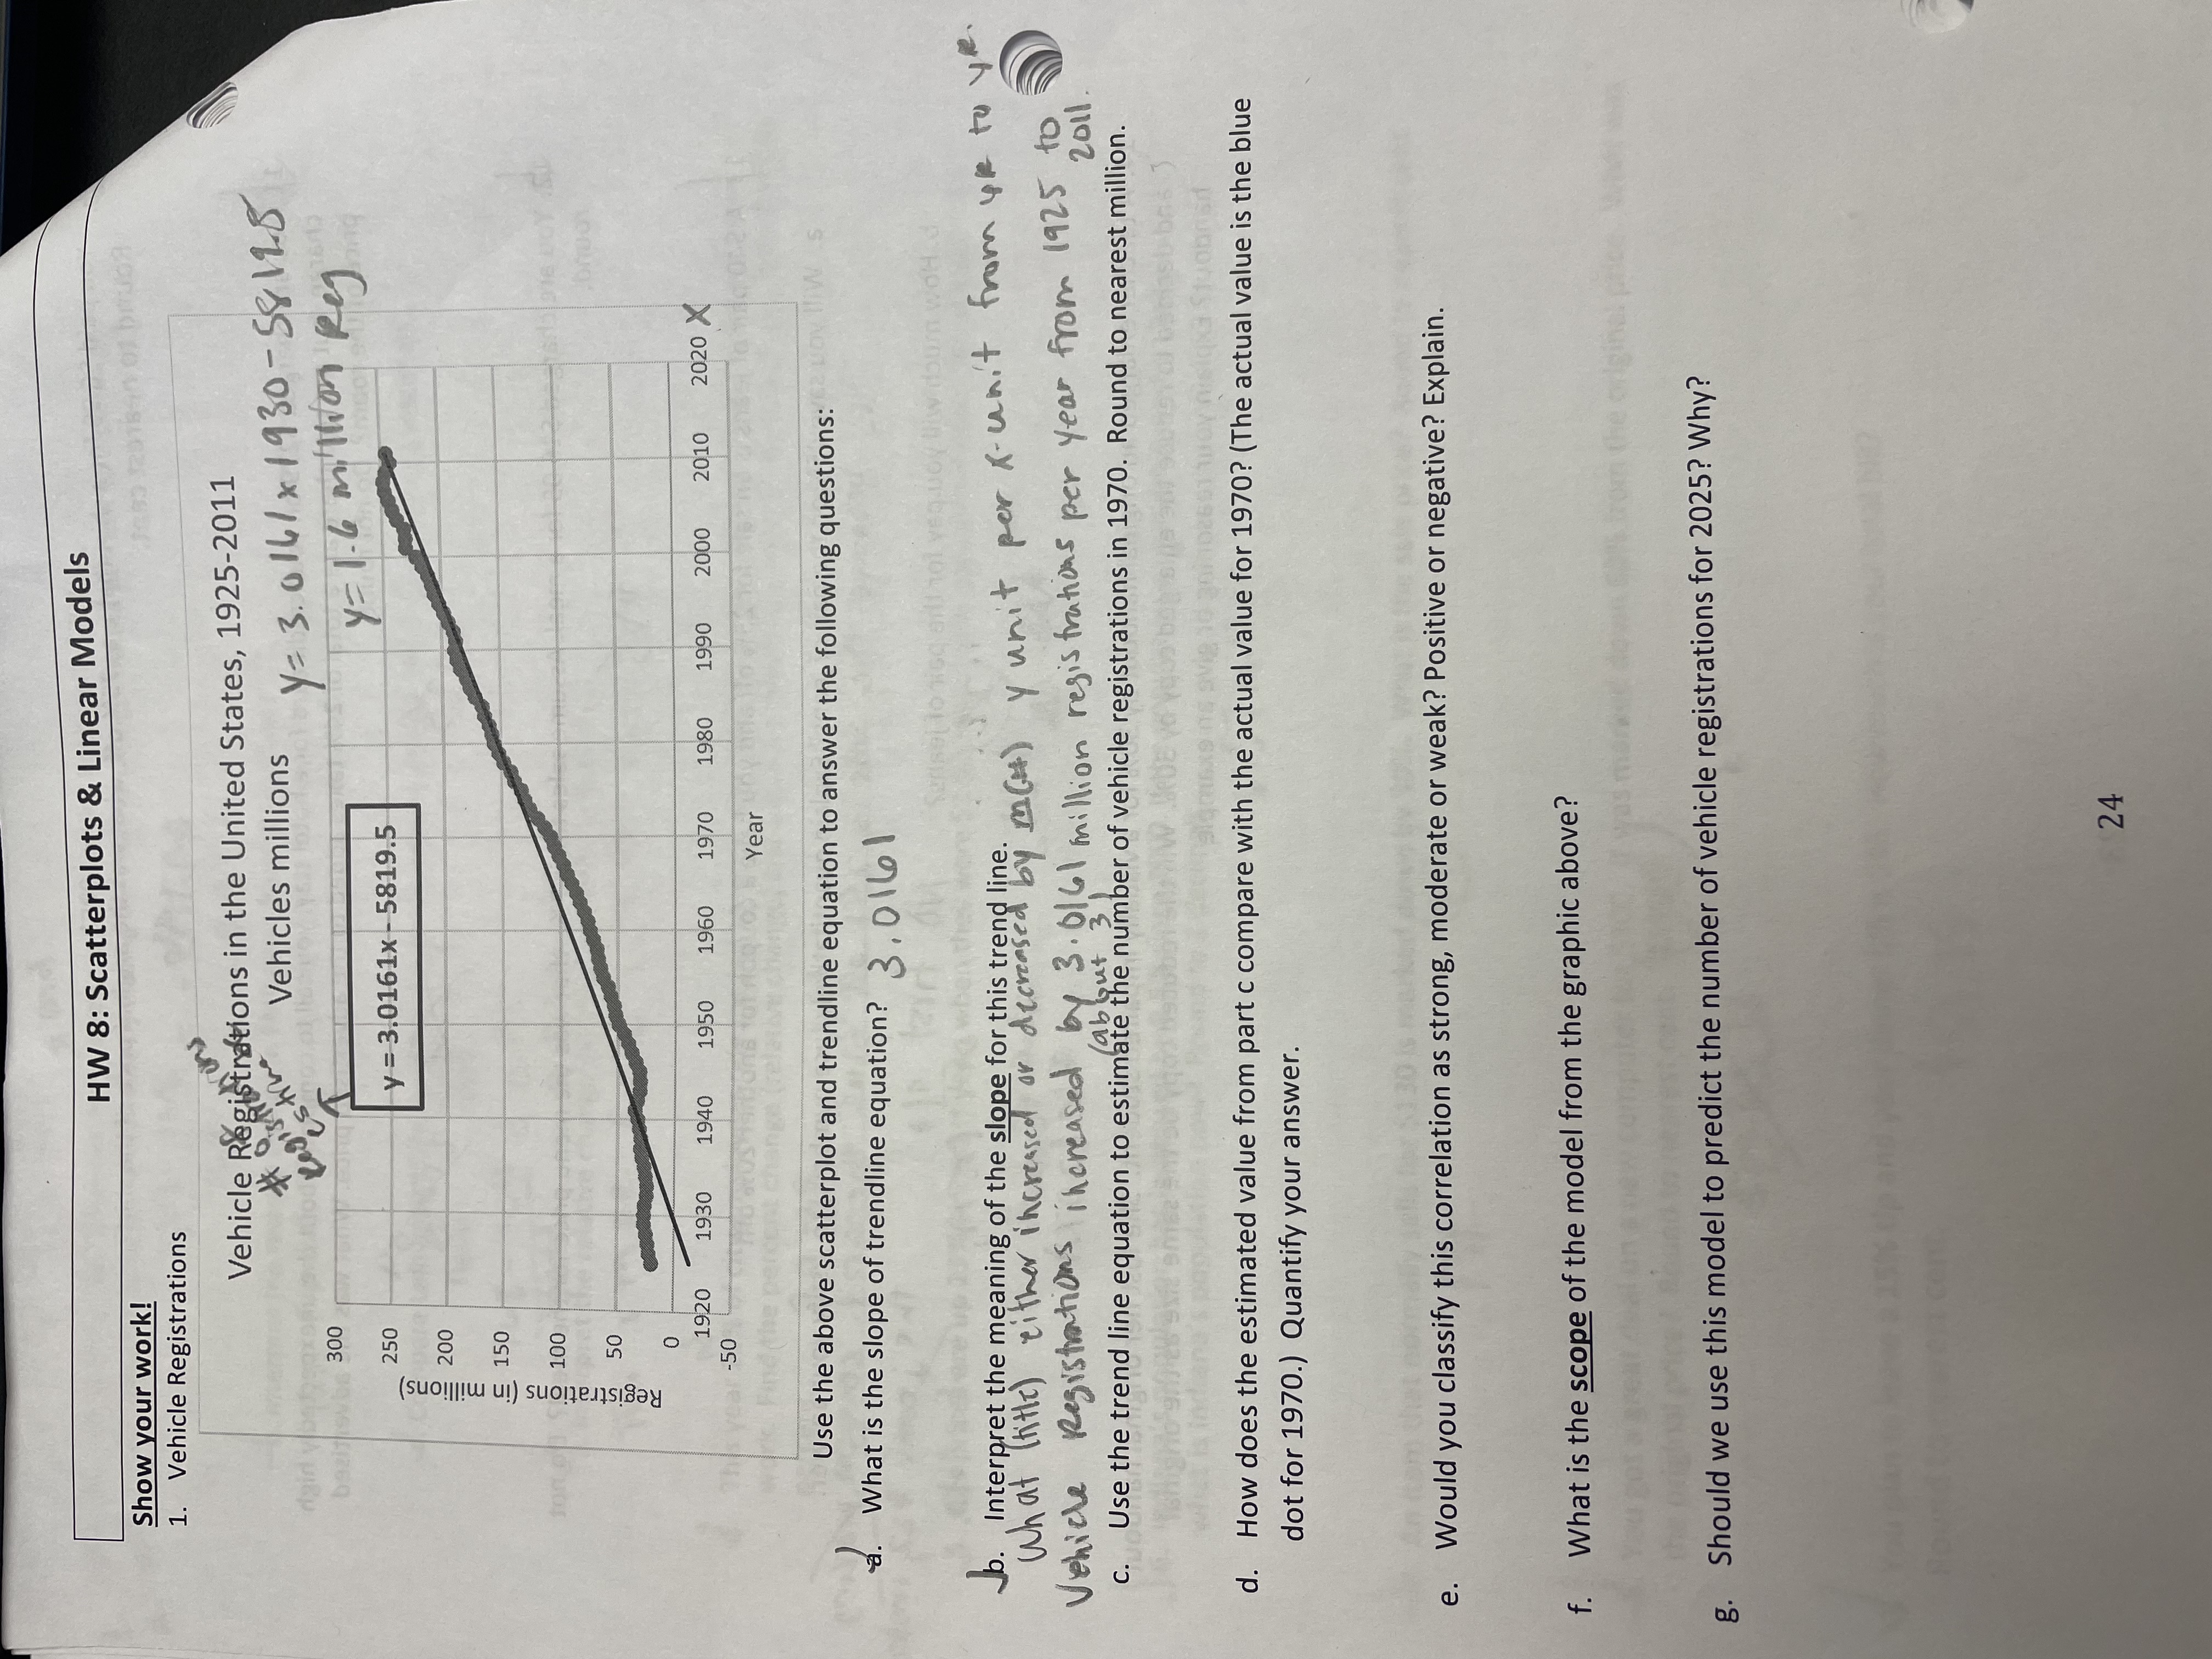
HW 8: Scatterplots & Linear Models Show your work! 1. Vehicle Registrations Vehicle Registr gistrations in the United States, 1925-2011 Register dairy estime Vehicles millions
Step by Step Solution
There are 3 Steps involved in it
Step: 1

Get Instant Access to Expert-Tailored Solutions
See step-by-step solutions with expert insights and AI powered tools for academic success
Step: 2

Step: 3
Ace Your Homework with AI
Get the answers you need in no time with our AI-driven, step-by-step assistance
Get Started
Modeling the Dynamics of Life Calculus and Probability for Life Scientists
Authors: Frederick R. Adler
3rd edition
840064187, 978-1285225975, 128522597X, 978-0840064189