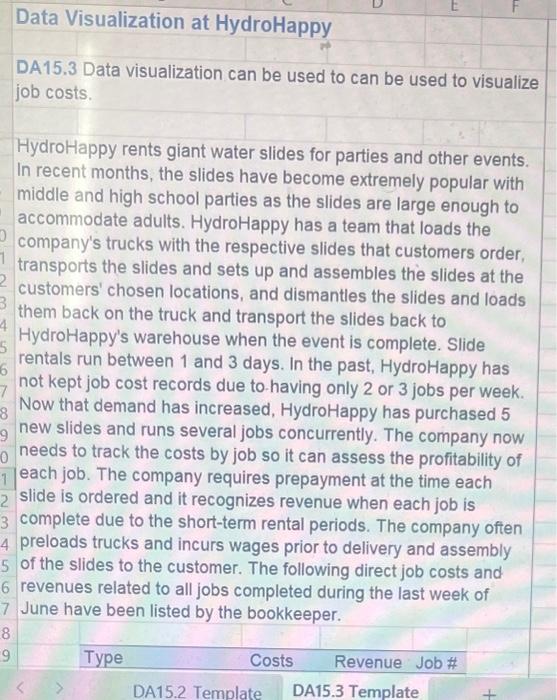
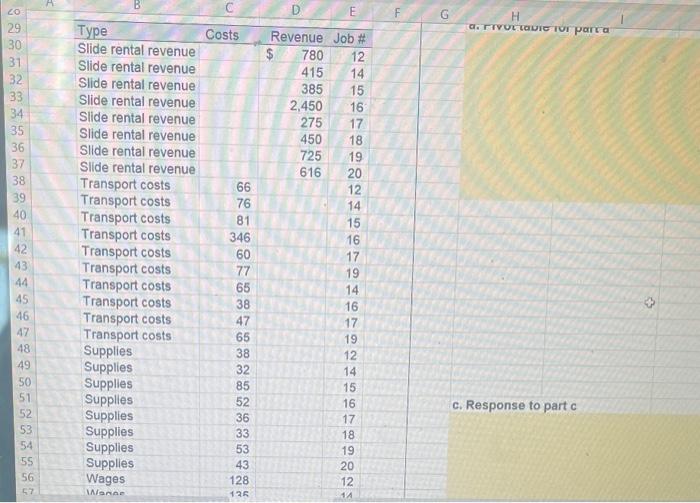
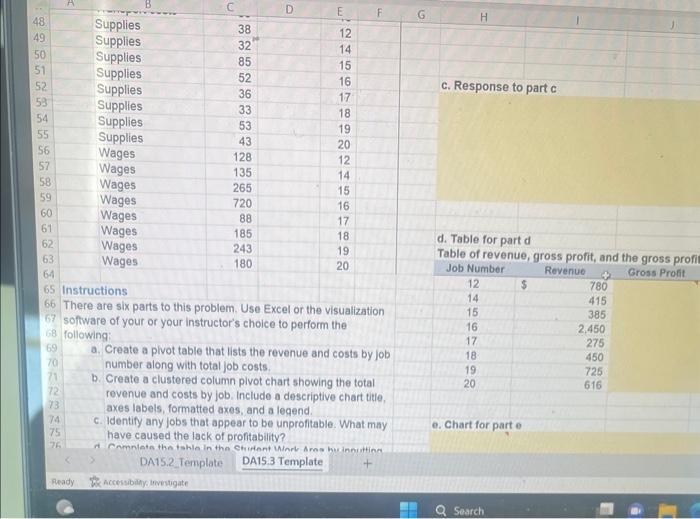
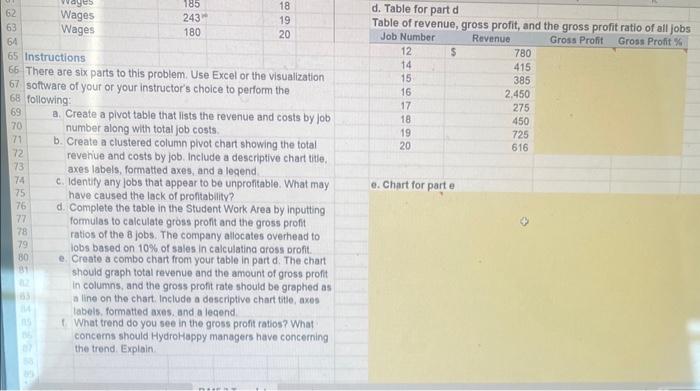
HydroHlappy rents giant water slides for parties and other events. In recent months, the slides have become extremely popular with middle and high school parties as the slides are large enough to accommodate adults. HydroHappy has a team that loads the company's trucks with the respective slides that customers order, transports the slides and sets up and assembles the slides at the customers' chosen locations, and dismantles the slides and loads them back on the truck and transport the slides back to HydroHappy's warehouse when the event is complete. Slide rentals run between 1 and 3 days. In the past, HydroHappy has not kept job cost records due to having only 2 or 3 jobs per week. Now that demand has increased, HydroHappy has purchased 5 new slides and runs several jobs concurrently. The company now needs to track the costs by job so it can assess the profitability of leach job. The company requires prepayment at the time each slide is ordered and it recognizes revenue when each job is complete due to the short-term rental periods. The company often preloads trucks and incurs wages prior to delivery and assembly of the slides to the customer. The following direct job costs and revenues related to all jobs completed during the last week of June have been listed by the bookkeeper. a. rroucaure ior parta d. Table for part a Tahle of rauanio Instructions There are six parts to this problem. Use Excel or the visualization software of your or your instructor's choice to perform the following: a. Create a plvot table that lists the revenue and costs by job number along with total job costs. b. Create a clustered column pivot chart showing the total revenue and costs by job. Include a descriptive chart titie, axes labels, formatted axes, and a legend. c. Identify any jobs that appear to be unprofitable. What may e. Chart for part e have caused the lack of profitability? d. Table for part d Table of revenue arnse nrofit Instructions There are six parts to this problem. Use Excel or the visualization software of your or your instructor's choice to perform the following: a. Create a pivot table that lists the revenue and costs by job number along with total job costs b. Create a clustered column pivot chart showing the total revehue and costs by job. Include a descriptive chart title. axes labels, formatted axes, and a legend c. Identify any lobs that appear to be unprofitable. What may have caused the lack of profitability? d. Complete the table in the Student Work Area by inputting formulas to calculate gross proft and the gross proft ratios of the 8 jobs. The company allocates overhead to lobs based on 10% of sales in calculatina oross orofit. e. Create a combo chart from your table in part d. The chart should graph total revenue and the amount of gross profit in columns, and the gross profit rate should be graphed as a line on the chart. Include a descriptive chart title, axes labels. formatted axes. and a legend. 1. What trend do you see in the gross proft ratios? What concerns should HydroHappy managers have concerning the trend. Explain HydroHlappy rents giant water slides for parties and other events. In recent months, the slides have become extremely popular with middle and high school parties as the slides are large enough to accommodate adults. HydroHappy has a team that loads the company's trucks with the respective slides that customers order, transports the slides and sets up and assembles the slides at the customers' chosen locations, and dismantles the slides and loads them back on the truck and transport the slides back to HydroHappy's warehouse when the event is complete. Slide rentals run between 1 and 3 days. In the past, HydroHappy has not kept job cost records due to having only 2 or 3 jobs per week. Now that demand has increased, HydroHappy has purchased 5 new slides and runs several jobs concurrently. The company now needs to track the costs by job so it can assess the profitability of leach job. The company requires prepayment at the time each slide is ordered and it recognizes revenue when each job is complete due to the short-term rental periods. The company often preloads trucks and incurs wages prior to delivery and assembly of the slides to the customer. The following direct job costs and revenues related to all jobs completed during the last week of June have been listed by the bookkeeper. a. rroucaure ior parta d. Table for part a Tahle of rauanio Instructions There are six parts to this problem. Use Excel or the visualization software of your or your instructor's choice to perform the following: a. Create a plvot table that lists the revenue and costs by job number along with total job costs. b. Create a clustered column pivot chart showing the total revenue and costs by job. Include a descriptive chart titie, axes labels, formatted axes, and a legend. c. Identify any jobs that appear to be unprofitable. What may e. Chart for part e have caused the lack of profitability? d. Table for part d Table of revenue arnse nrofit Instructions There are six parts to this problem. Use Excel or the visualization software of your or your instructor's choice to perform the following: a. Create a pivot table that lists the revenue and costs by job number along with total job costs b. Create a clustered column pivot chart showing the total revehue and costs by job. Include a descriptive chart title. axes labels, formatted axes, and a legend c. Identify any lobs that appear to be unprofitable. What may have caused the lack of profitability? d. Complete the table in the Student Work Area by inputting formulas to calculate gross proft and the gross proft ratios of the 8 jobs. The company allocates overhead to lobs based on 10% of sales in calculatina oross orofit. e. Create a combo chart from your table in part d. The chart should graph total revenue and the amount of gross profit in columns, and the gross profit rate should be graphed as a line on the chart. Include a descriptive chart title, axes labels. formatted axes. and a legend. 1. What trend do you see in the gross proft ratios? What concerns should HydroHappy managers have concerning the trend. Explain


