Answered step by step
Verified Expert Solution
Link Copied!

Question

1 Approved Answer

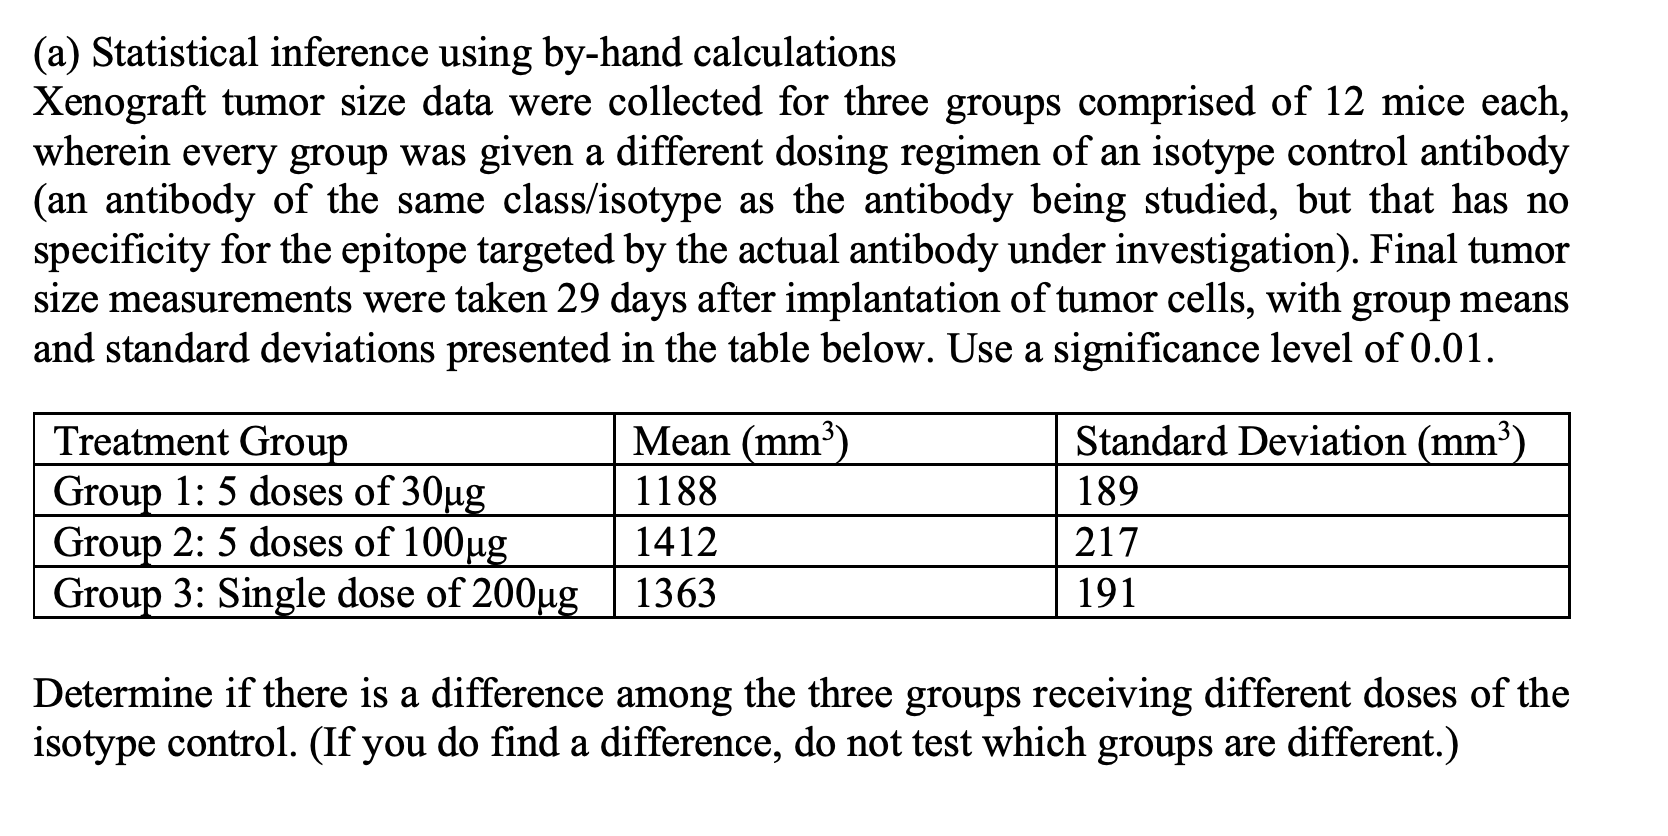
Hypothesis Testing (a) Statistical inference using by-hand calculations Xenograft tumor size data were collected for three groups comprised of 12 mice each, wherein every group

Hypothesis Testing

image text in transcribed
(a) Statistical inference using by-hand calculations Xenograft tumor size data were collected for three groups comprised of 12 mice each, wherein every group was given a different dosing regimen of an isotype control antibody (an antibody of the same class/isotype as the antibody being studied, but that has no specificity for the epitope targeted by the actual antibody under investigation). Final tumor size measurements were taken 29 days after implantation of tumor cells, with group means and standard deviations presented in the table below. Use a significance level of 0.01. Treatment Group Mean (mm3 Standard Deviation (mm3 Group 1: 5 doses of 30ug 1188 189 Group 2: 5 doses of 100ug 1412 217 Group 3: Single dose of 200ug 1363 191 Determine if there is a difference among the three groups receiving different doses of the isotype control. (If you do find a difference, do not test which groups are different.)

Step by Step Solution

There are 3 Steps involved in it

Step: 1

blur-text-image

Get Instant Access to Expert-Tailored Solutions

See step-by-step solutions with expert insights and AI powered tools for academic success

Step: 2

blur-text-image

Step: 3

blur-text-image

Ace Your Homework with AI

Get the answers you need in no time with our AI-driven, step-by-step assistance

Get Started

Recommended Textbook for

Core Connections Algebra 2

Authors: Leslie Dietiker, Judy Kysh, Tom Sallee, Brian Hoey

Student Edition

1603281150, 978-1603281157

More Books

Students also viewed these Mathematics questions