

Answered step by step
Verified Expert Solution
Question
1 Approved Answer
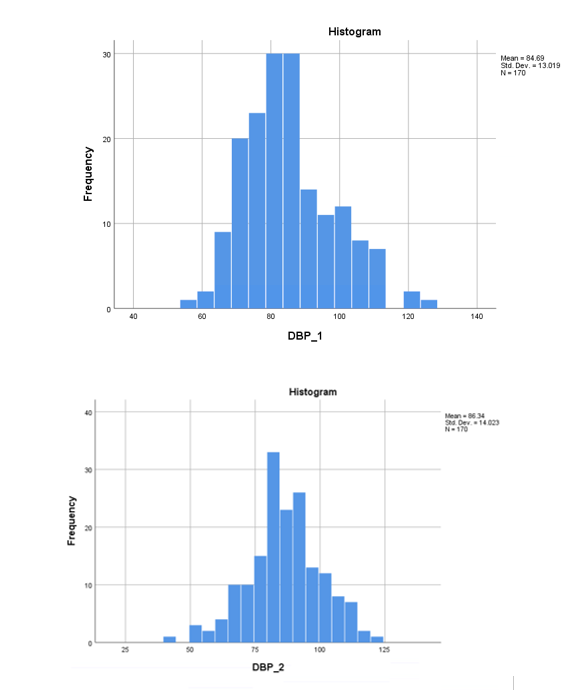
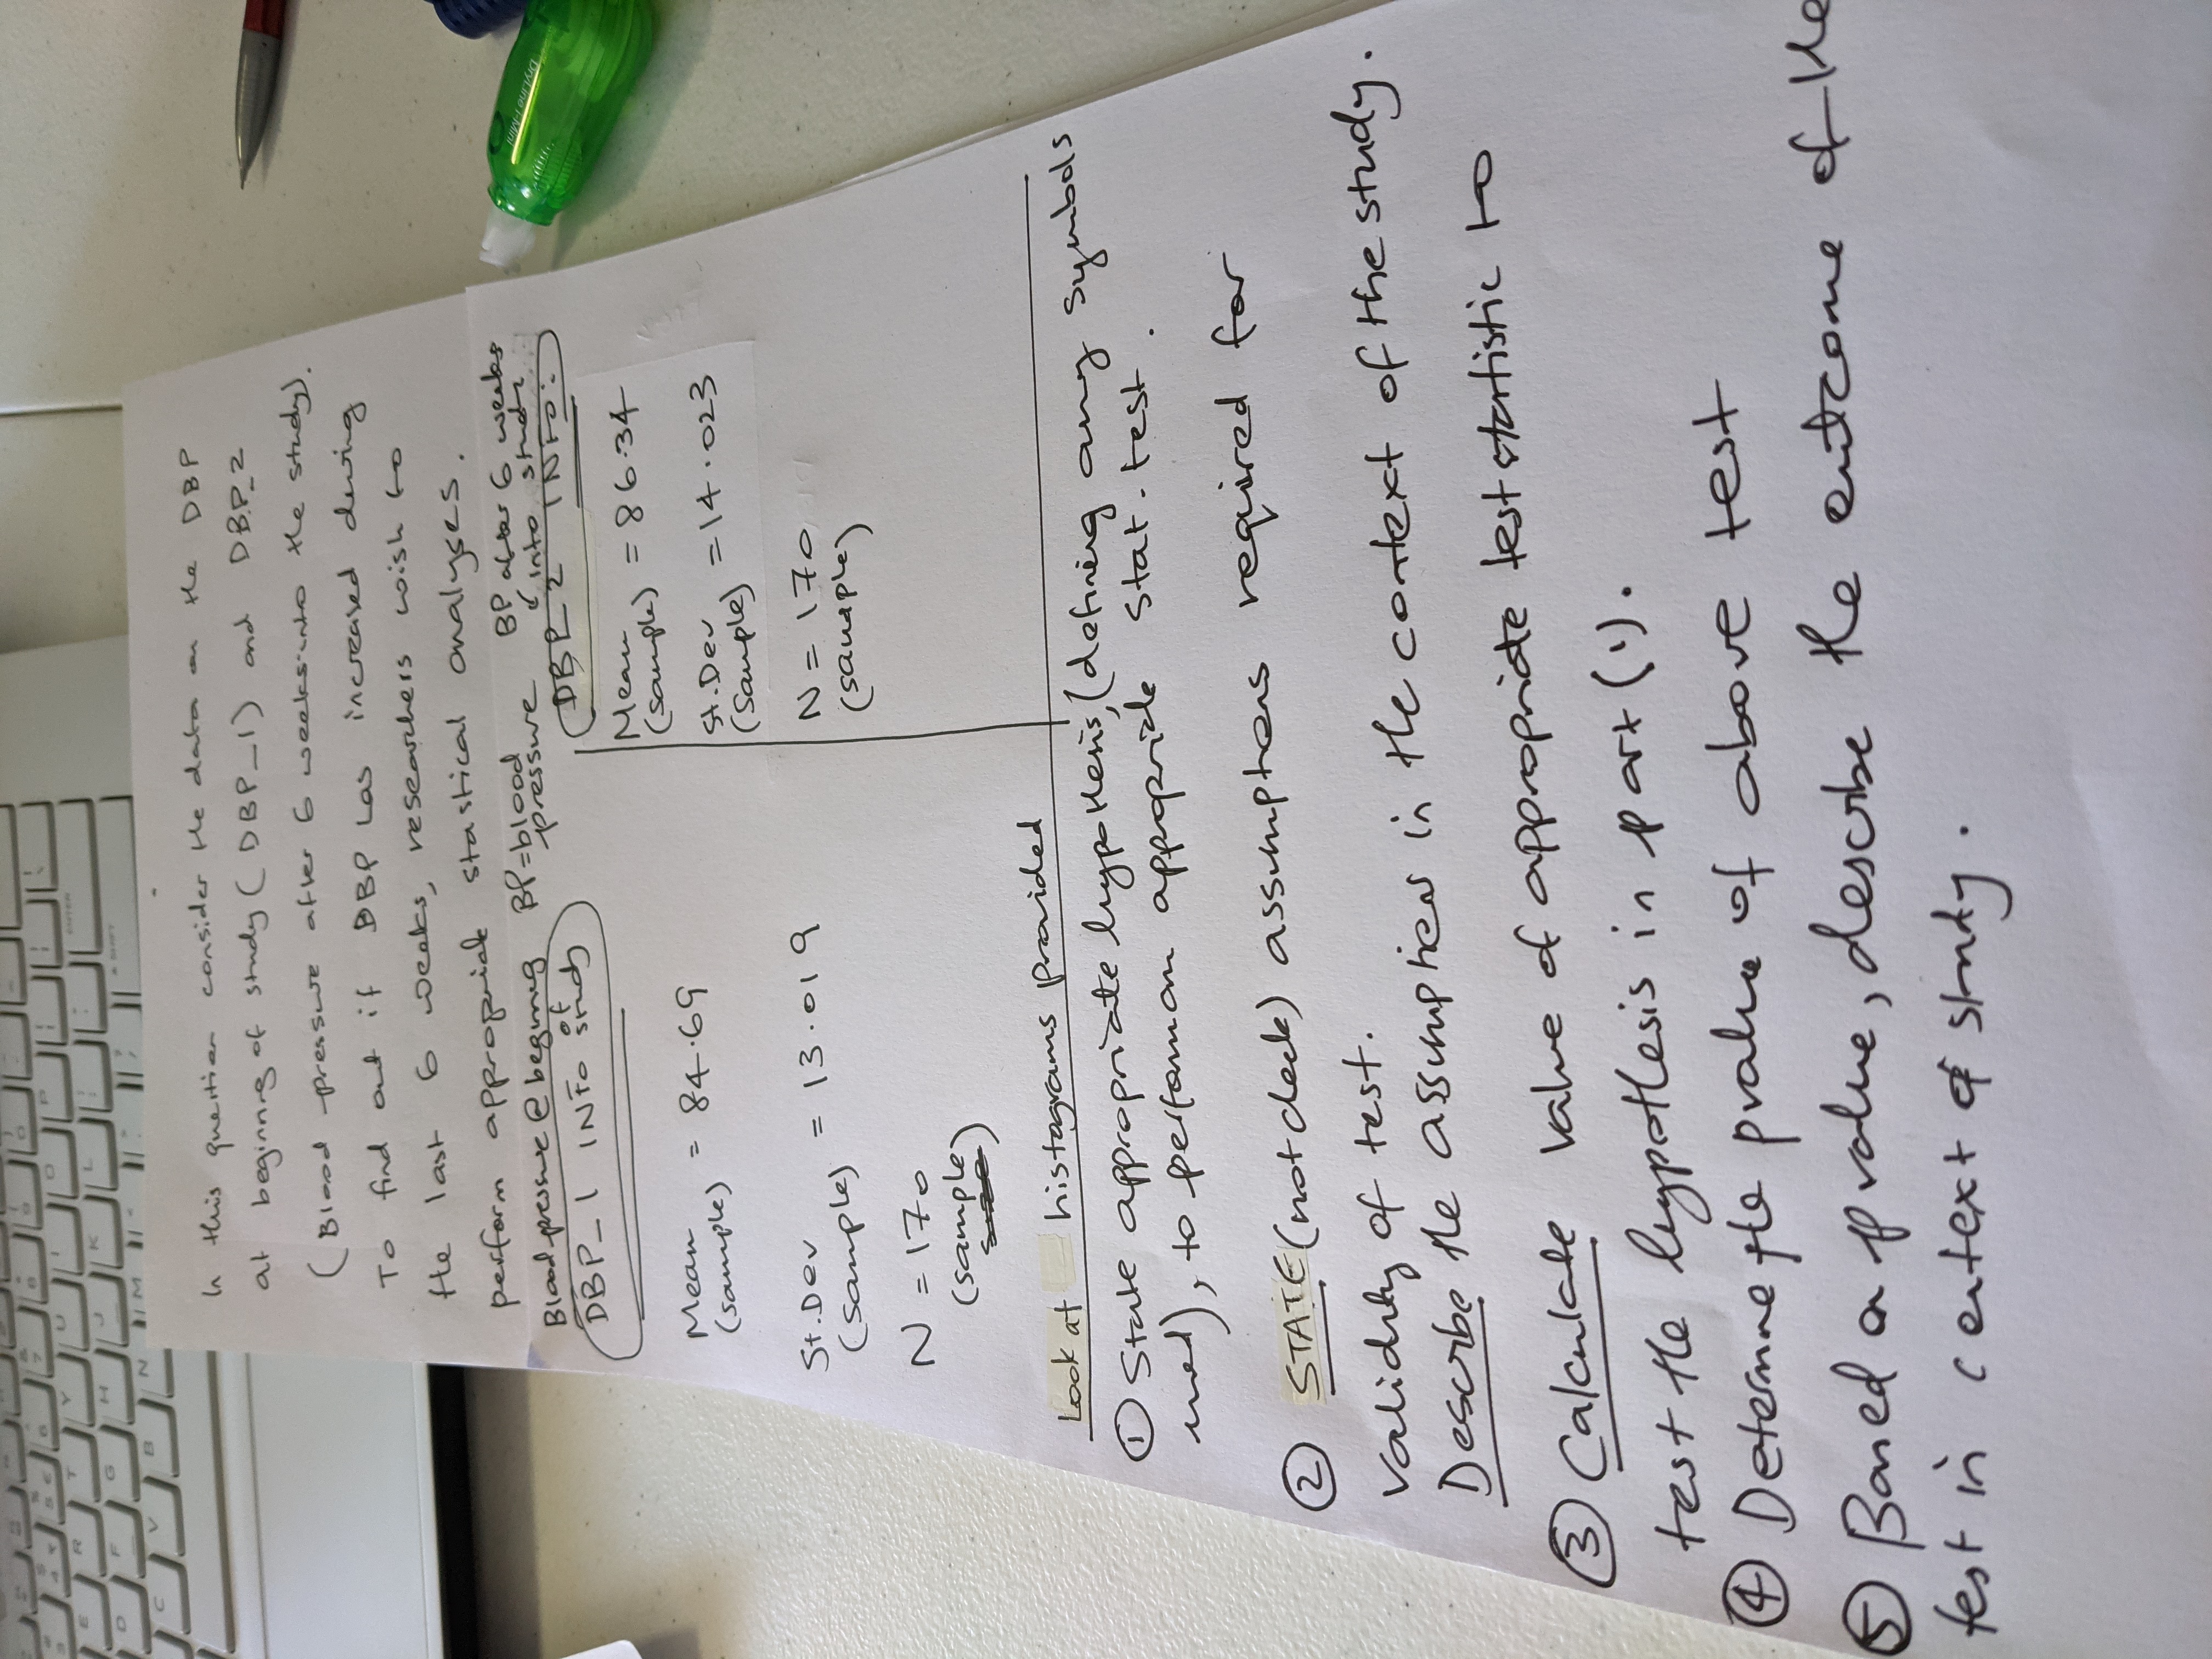
Hypothesis/test stat/statistics... Give in detail explanation -step by step full workout with formulas clearly included.See both images.1 of image has the histograms. Zoom in for
Hypothesis/test stat/statistics... Give in detail explanation -step by step full workout with formulas clearly included.See both images.1 of image has the histograms. Zoom in for to seee
Step by Step Solution
There are 3 Steps involved in it
Step: 1

Get Instant Access to Expert-Tailored Solutions
See step-by-step solutions with expert insights and AI powered tools for academic success
Step: 2

Step: 3
Ace Your Homework with AI
Get the answers you need in no time with our AI-driven, step-by-step assistance
Get Started
Trigonometry
Authors: Cynthia Y Young
5th Edition
1119820928, 9781119820925