I am building a financial model and the balance sheet is not balancing. Attached are photos of the current balance sheet.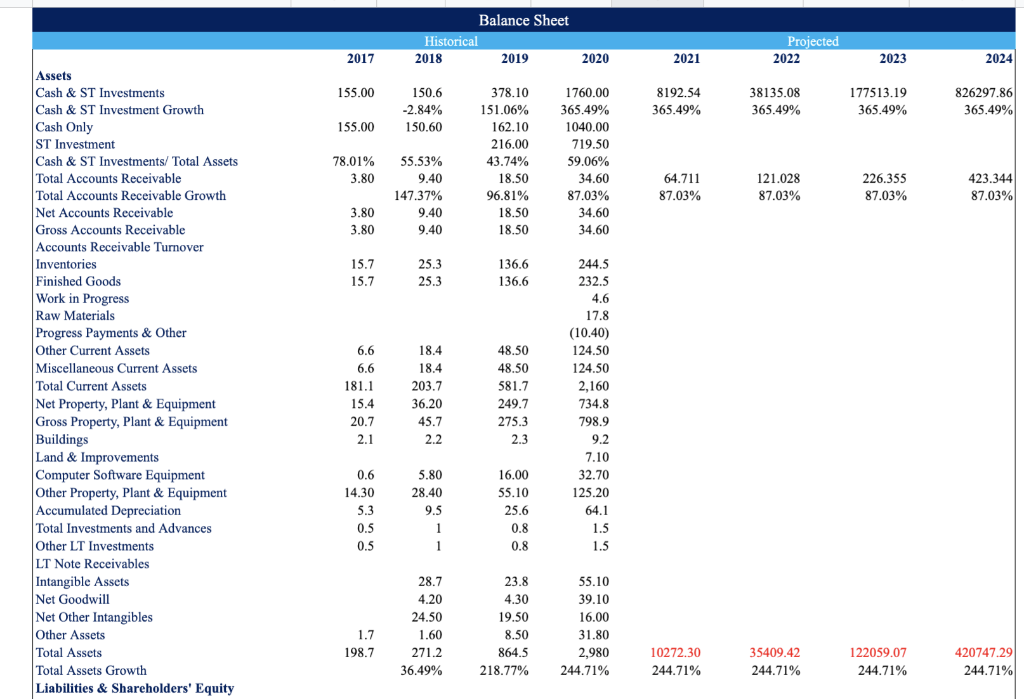
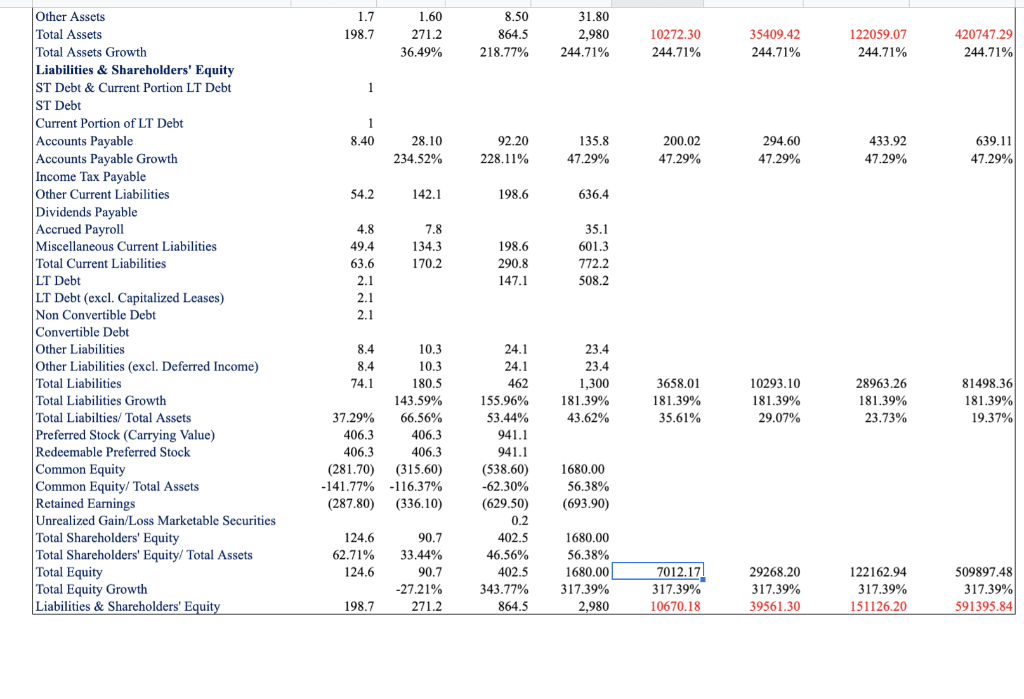
Balance Sheet Historical 2018 2019 Projected 2022 2017 2020 2021 2023 2024 155.00 150.6 -2.84% 150.60 8192.54 365.49% 38135.08 365.49% 177513.19 365.49% 826297.86 365.49% 155.00 78.01% 3.80 55.53% 9.40 147.37% 9.40 9.40 378.10 151.06% 162.10 216.00 43.74% 18.50 96.81% 18.50 18.50 1760.00 365.49% 1040.00 719.50 59.06% 34.60 87.03% 34.60 34.60 64.711 87.03% 121.028 87.03% 226.355 87.03% 423.344 87.03% 3.80 3.80 15.7 15.7 25.3 25.3 136.6 136.6 Assets Cash & ST Investments Cash & ST Investment Growth Cash Only ST Investment Cash & ST Investments/Total Assets Total Accounts Receivable Total Accounts Receivable Growth Net Accounts Receivable Gross Accounts Receivable Accounts Receivable Turnover Inventories Finished Goods Work in Progress Raw Materials Progress Payments & Other Other Current Assets Miscellaneous Current Assets Total Current Assets Net Property, Plant & Equipment Gross Property, Plant & Equipment Buildings Land & Improvements Computer Software Equipment Other Property, Plant & Equipment Accumulated Depreciation Total Investments and Advances Other LT Investments LT Note Receivables Intangible Assets Net Goodwill Net Other Intangibles Other Assets Total Assets Total Assets Growth Liabilities & Shareholders' Equity 6.6 6.6 181.1 15.4 20.7 2.1 18.4 18.4 203.7 36.20 45.7 2.2 48.50 48.50 581.7 249.7 275.3 2.3 244.5 232.5 4.6 17.8 (10.40) 124.50 124.50 2,160 734.8 798.9 9.2 7.10 32.70 125.20 64.1 1.5 1.5 5.80 0.6 14.30 5.3 28.40 16.00 55.10 25.6 0.8 0.8 9.5 1 1 0.5 0.5 28.7 4.20 24.50 1.60 271.2 36.49% 23.8 4.30 19.50 8.50 864.5 218.77% 55.10 39.10 16.00 31.80 2,980 244.71% 1.7 198.7 10272.30 244.71% 35409.42 244.71% 122059.07 244.71% 420747.29 244.71% 1.7 198.7 1.60 271.2 36.49% 8.50 864.5 218.77% 31.80 2,980 244.71% 10272.30 244.71% 35409.42 244.71% 122059.07 244.71% 420747.29 244.71% 1 1 8.40 28.10 234.52% 92.20 228.11% 135.8 47.29% 200.02 47.29% 294.60 47.29% 433.92 47.29% 639.11 47.29% 54.2 142.1 198.6 636.4 7.8 134,3 170.2 4.8 49.4 63.6 2.1 2.1 2.1 198.6 290.8 147.1 Other Assets Total Assets Total Assets Growth Liabilities & Shareholders' Equity ST Debt & Current Portion LT Debt ST Debt Current Portion of LT Debt Accounts Payable Accounts Payable Growth Income Tax Payable Other Current Liabilities Dividends Payable Accrued Payroll Miscellaneous Current Liabilities Total Current Liabilities LT Debt LT Debt (excl. Capitalized Leases) Non Convertible Debt Convertible Debt Other Liabilities Other Liabilities (excl. Deferred Income) Total Liabilities Total Liabilities Growth Total Liabilties/ Total Assets Preferred Stock (Carrying Value) Redeemable Preferred Stock Common Equity Common Equity/Total Assets Retained Earnings Unrealized Gain/Loss Marketable Securities Total Shareholders' Equity Total Shareholders' Equity/Total Assets Total Equity Total Equity Growth Liabilities & Shareholders' Equity & 35.1 601.3 772.2 508.2 23.4 23.4 1,300 181.39% 43.62% 3658.01 181.39% 35.61% 10293.10 181.39% 29.07% 28963.26 181.39% 23.73% 81498.36 181.39% 19.37% 8.4 10.3 8.4 10.3 74.1 180.5 143.59% 37.29% 66.56% 406.3 406.3 406.3 406.3 (281.70) (315.60) -141.77% -116.37% (287.80) (336.10) 24.1 24.1 462 155.96% 53.44% 941.1 941.1 (538.60) -62.30% (629.50) 0.2 402.5 46.56% 402.5 343.77% % 864.5 1680.00 56.38% (693.90) 124.6 62.71% 124.6 90.7 33.44% 90.7 -27.21% 271.2 1680.00 56.38% 1680.00 317.39% 2,980 7012.17 317.39% 10670.18 29268.20 317.39% 39561.30 122162.94 317.39% 151126.20 509897.48 317.39% 591395.84 198.7