

Question
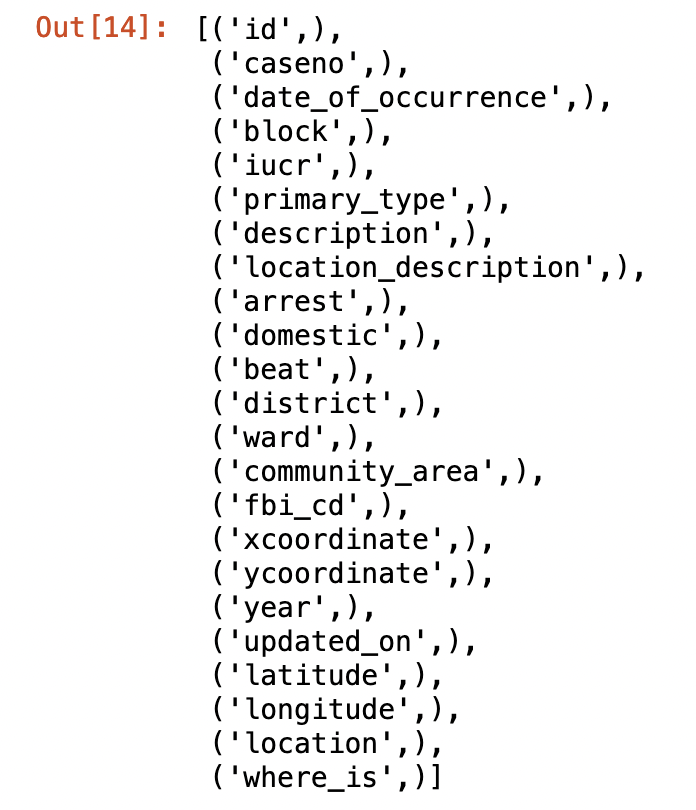
I am having trouble answering the question below. The data I am using are in the following 2 tables below. This table is called chicago.
I am having trouble answering the question below.
The data I am using are in the following 2 tables below.
This table is called "chicago". Theft, battery, assault, and robbery can be found in rows within the "primary_type" column.
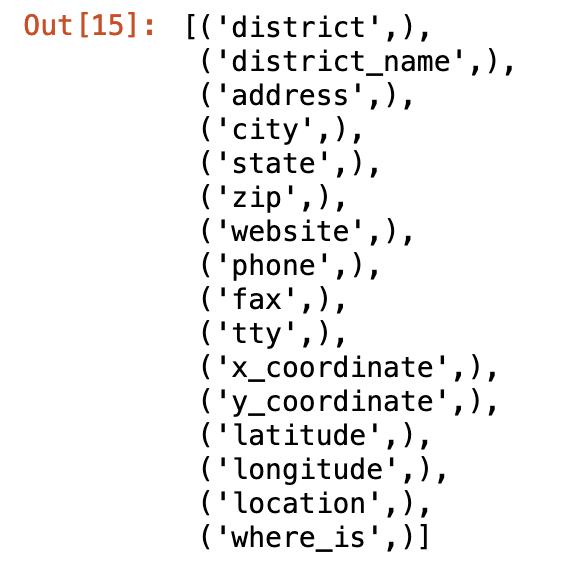
The other table I am working with below is called "police_stations".
Any help here is greatly appreciated!
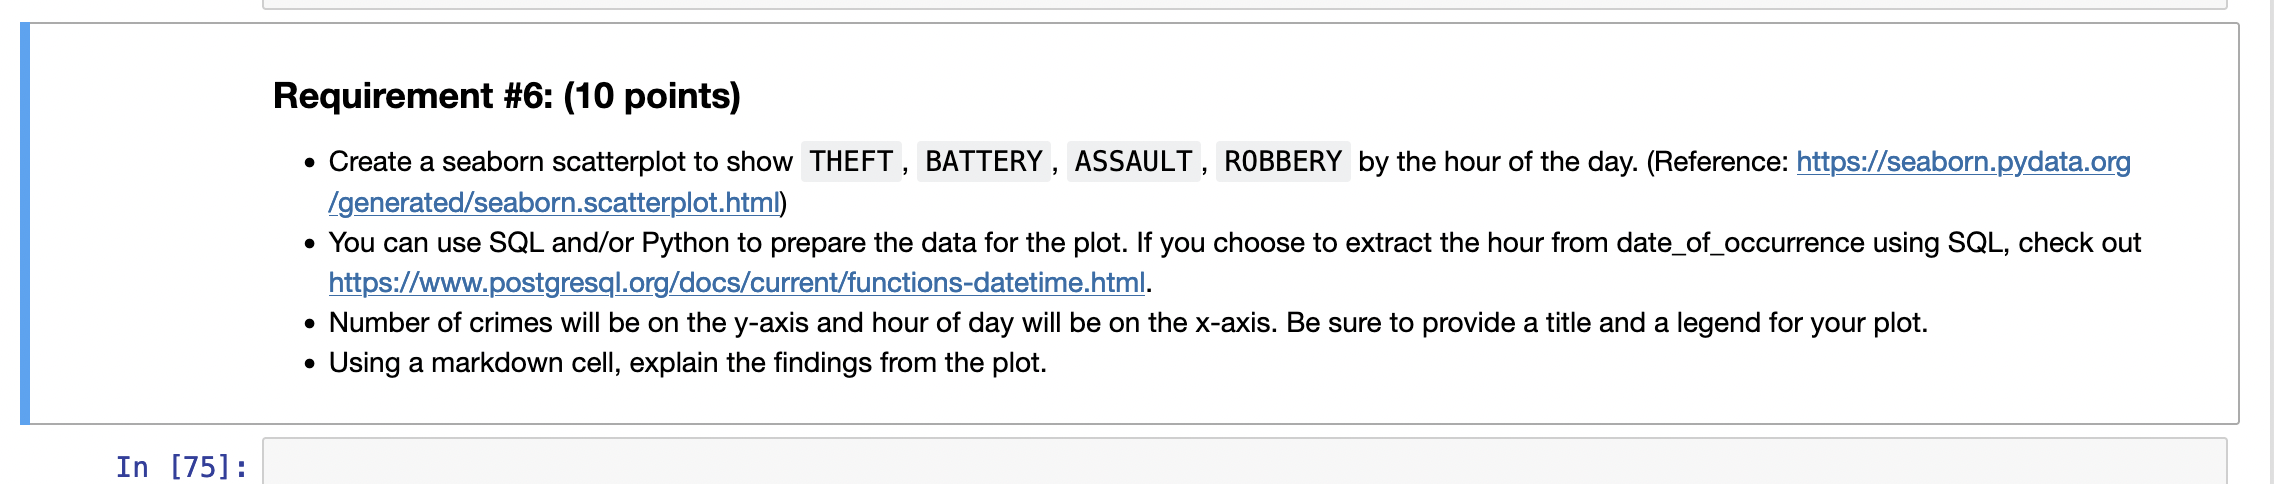
Requirement \#6: (10 points) - Create a seaborn scatterplot to show THEFT, BATTERY, ASSAULT, ROBBERY by the hour of the day. (Reference: https://seaborn.pydata.org - You can use SQL and/or Python to prepare the data for the plot. If you choose to extract the hour from date_of_occurrence using SQL, check out https://www.postgresql.org/docs/current/functions-datetime.html. - Number of crimes will be on the y-axis and hour of day will be on the x-axis. Be sure to provide a title and a legend for your plot. - Using a markdown cell, explain the findings from the plotStep by Step Solution
There are 3 Steps involved in it
Step: 1

Get Instant Access to Expert-Tailored Solutions
See step-by-step solutions with expert insights and AI powered tools for academic success
Step: 2

Step: 3
Ace Your Homework with AI
Get the answers you need in no time with our AI-driven, step-by-step assistance
Get Started
Database Management System MCQs Multiple Choice Questions And Answers
Authors: Arshad Iqbal
1st Edition
1073328554, 978-1073328550