I am having trouble finding the pooled proportion. For the following first questions. For the second set of questions I am having trouble determining whether the scenario is about population proportion. Determine the test statistics A-D of second part.
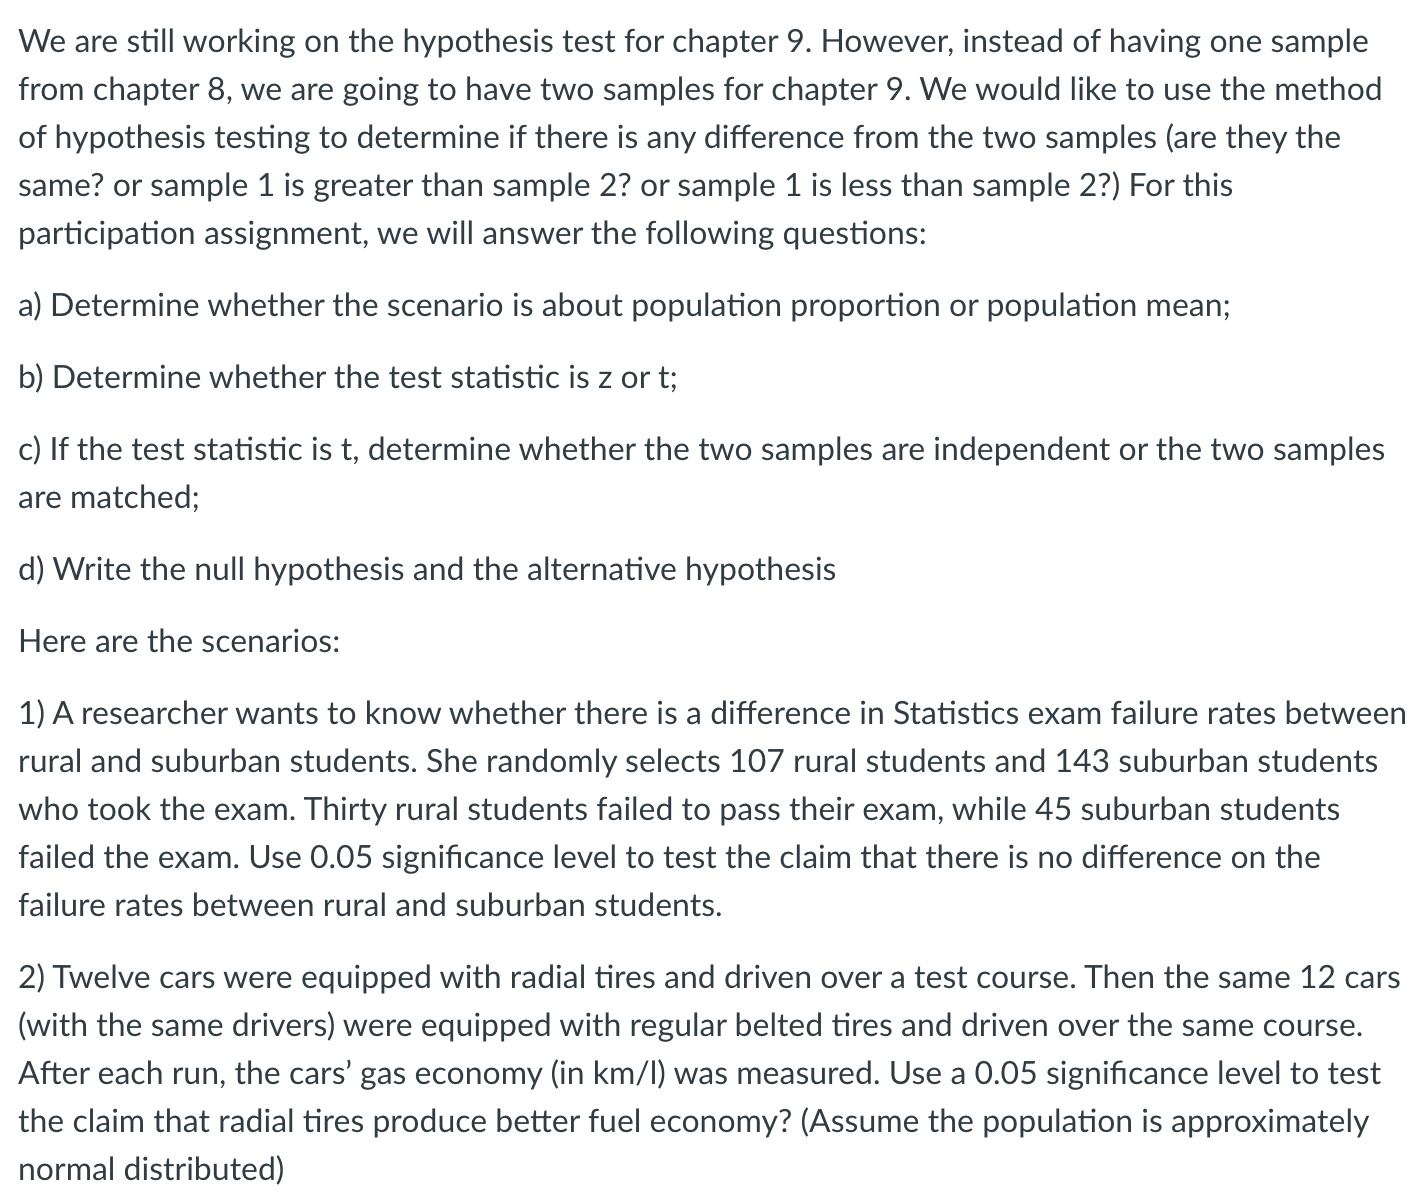
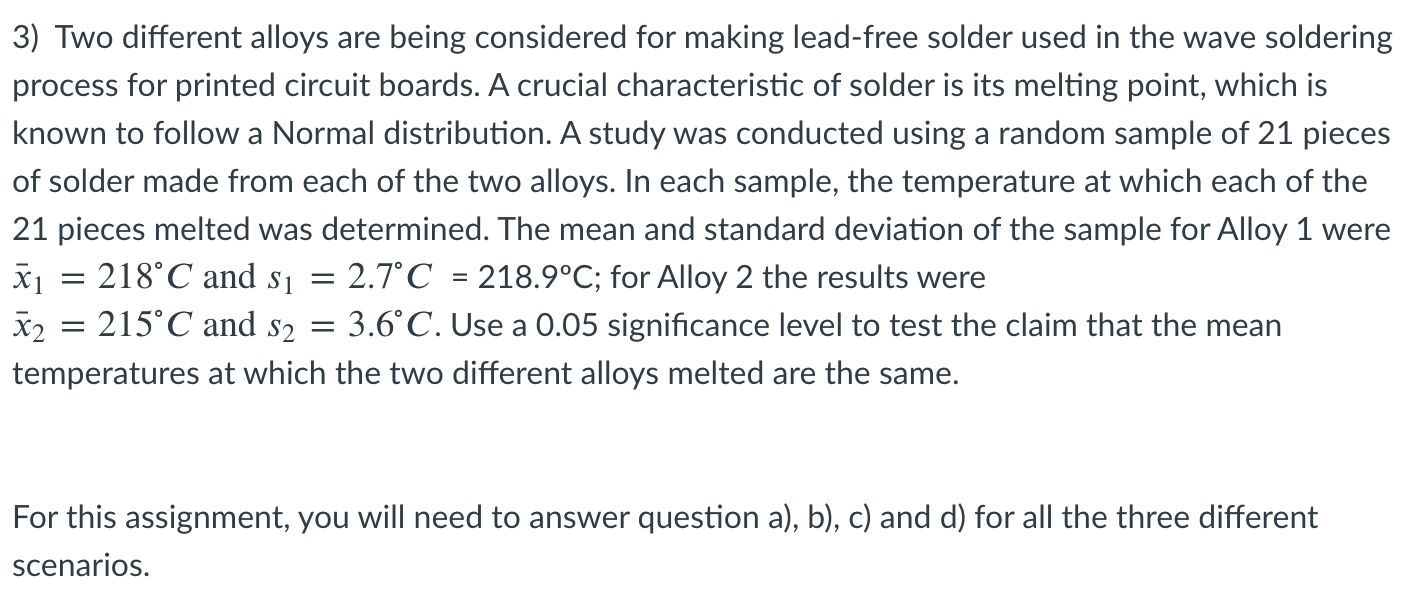
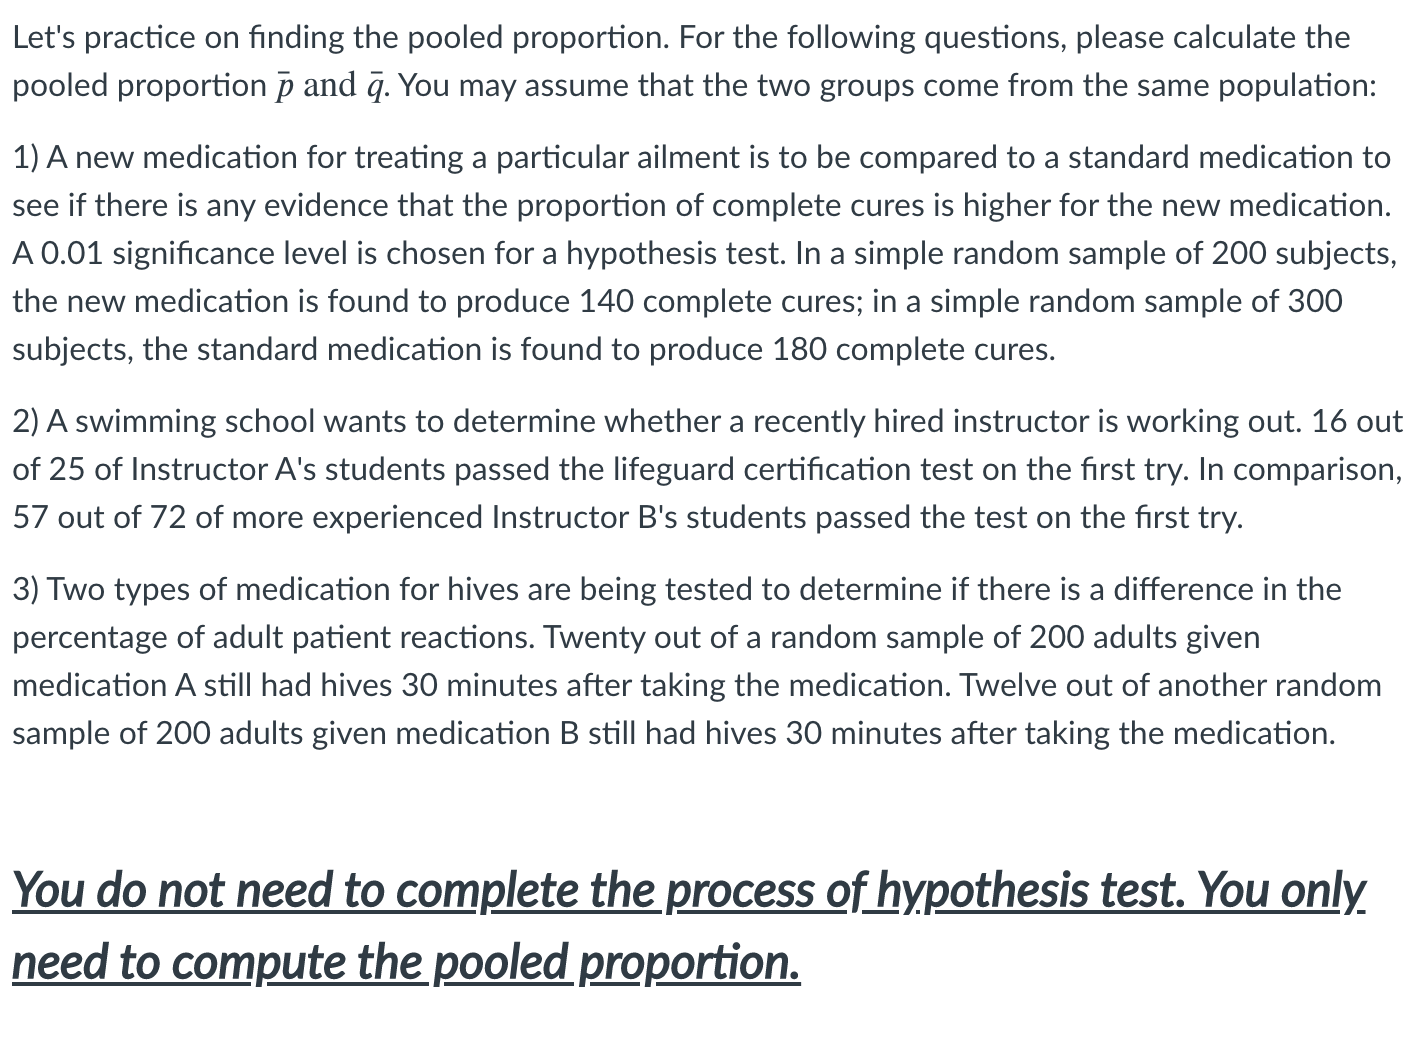
We are still working on the hypothesis test for chapter 9. However, instead of having one sample from chapter 8, we are going to have two samples for chapter 9. We would like to use the method of hypothesis testing to determine if there is any difference from the two samples (are they the same? or sample 1 is greater than sample 2? or sample 1 is less than sample 2?) For this participation assignment, we will answer the following questions: a) Determine whether the scenario is about population proportion or population mean; b) Determine whether the test statistic is z or t; c) If the test statistic is t, determine whether the two samples are independent or the two samples are matched; d) Write the null hypothesis and the alternative hypothesis Here are the scenarios: 1) A researcher wants to know whether there is a difference in Statistics exam failure rates between rural and suburban students. She randomly selects 107 rural students and 143 suburban students who took the exam. Thirty rural students failed to pass their exam, while 45 suburban students failed the exam. Use 0.05 signicance level to test the claim that there is no difference on the failure rates between rural and suburban students. 2) Twelve cars were equipped with radial tires and driven over a test course. Then the same 12 cars (with the same drivers) were equipped with regular belted tires and driven over the same course. After each run, the cars' gas economy (in km/l) was measured. Use a 0.05 signicance level to test the claim that radial tires produce better fuel economy? (Assume the population is approximately normal distributed) 3) Two different alloys are being considered for making lead-free solder used in the wave soldering process for printed circuit boards. A crucial characteristic of solder is its melting point, which is known to follow a Normal distribution. A study was conducted using a random sample of 21 pieces of solder made from each of the two alloys. In each sample, the temperature at which each of the 21 pieces melted was determined. The mean and standard deviation of the sample for Alloy 1 were 561 = 218C and $1 = 2.7\"C = 218.9C; for Alloy 2 the results were 5c; = 215C and 32 = 3.6\"C. Use a 0.05 signicance level to test the claim that the mean temperatures at which the two different alloys melted are the same. For this assignment, you will need to answer question a), b), c) and d) for all the three different scenarios. Let's practice on finding the pooled proportion. For the following questions, please calculate the pooled proportion p and q. You may assume that the two groups come from the same population: 1) A new medication for treating a particular ailment is to be compared to a standard medication to see if there is any evidence that the proportion of complete cures is higher for the new medication. A 0.01 significance level is chosen for a hypothesis test. In a simple random sample of 200 subjects, the new medication is found to produce 140 complete cures; in a simple random sample of 300 subjects, the standard medication is found to produce 180 complete cures. 2) A swimming school wants to determine whether a recently hired instructor is working out. 16 out of 25 of Instructor A's students passed the lifeguard certification test on the first try. In comparison, 57 out of 72 of more experienced Instructor B's students passed the test on the first try. 3) Two types of medication for hives are being tested to determine if there is a difference in the percentage of adult patient reactions. Twenty out of a random sample of 200 adults given medication A still had hives 30 minutes after taking the medication. Twelve out of another random sample of 200 adults given medication B still had hives 30 minutes after taking the medication. You do not need to complete the process of hypothesis test. You only need to compute the pooled proportion