

Question
I am having trouble getting the plot to show a sphere of orange arrows. I can get it to make a circle of arrows only.
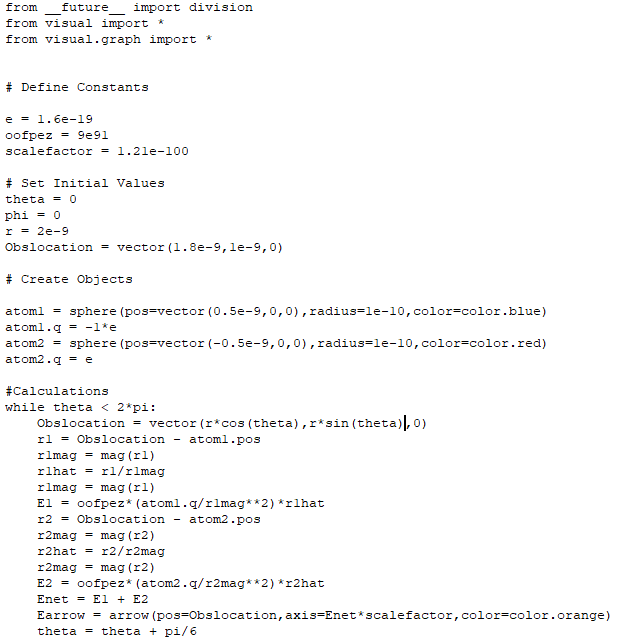
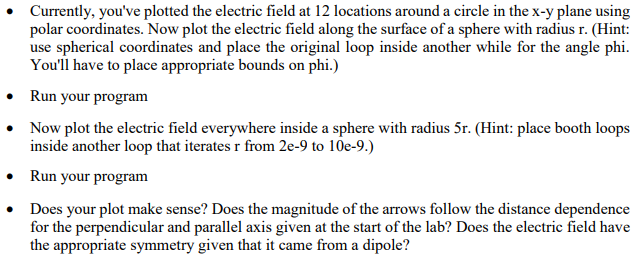
I am having trouble getting the plot to show a sphere of orange arrows. I can get it to make a circle of arrows only. I know in spherical coordinates the range of theta should be from 0 to 2*pi, phi should be 0 to pi, and R should be 0 to R. Also, since I want 12 arrows I have theta increasing by pi/6 so that it makes 12 iterations in the loop. I am confused how I should write my other two loops to make a sphere. It is all programmed in Vpython on Vidle, and 'oofpez' should be oofpez = 9e9. Thank you!
from_future__ import division from visual import * from visual.graph import * # Define Constants e = 1.6e-19 oofpez = 9e91 scalefactor = 1.2le-100 # Set Initial Values theta = 0 phi = 0 r = 2e-9 Obslocation = vector (1.8e-9, le-9,0) # Create Objects atoml = sphere (pos=vector (0.5e-9,0,0), radius=le-10, color=color.blue) atoml.q = -1*e atom2 = sphere (pos-vector (-0.5e-9,0,0), radius-le-10, color=color.red) atom2.q=e #Calculations while thetaStep by Step Solution
There are 3 Steps involved in it
Step: 1

Get Instant Access to Expert-Tailored Solutions
See step-by-step solutions with expert insights and AI powered tools for academic success
Step: 2

Step: 3
Ace Your Homework with AI
Get the answers you need in no time with our AI-driven, step-by-step assistance
Get Started
Database And Expert Systems Applications Dexa 2023 Workshops 34th International Conference Dexa 2023 Penang Malaysia August 28 30 2023 Proceedings
Authors: Gabriele Kotsis ,A Min Tjoa ,Ismail Khalil ,Bernhard Moser ,Atif Mashkoor ,Johannes Sametinger ,Maqbool Khan
1st Edition