I am having trouble with these sections 1-11
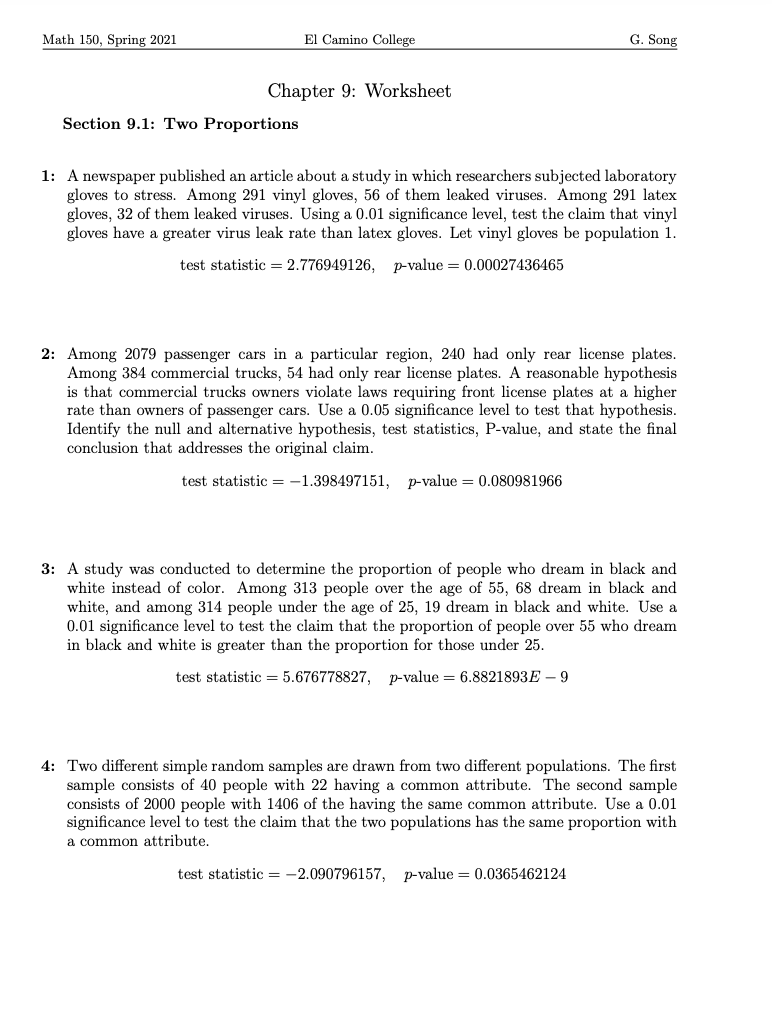
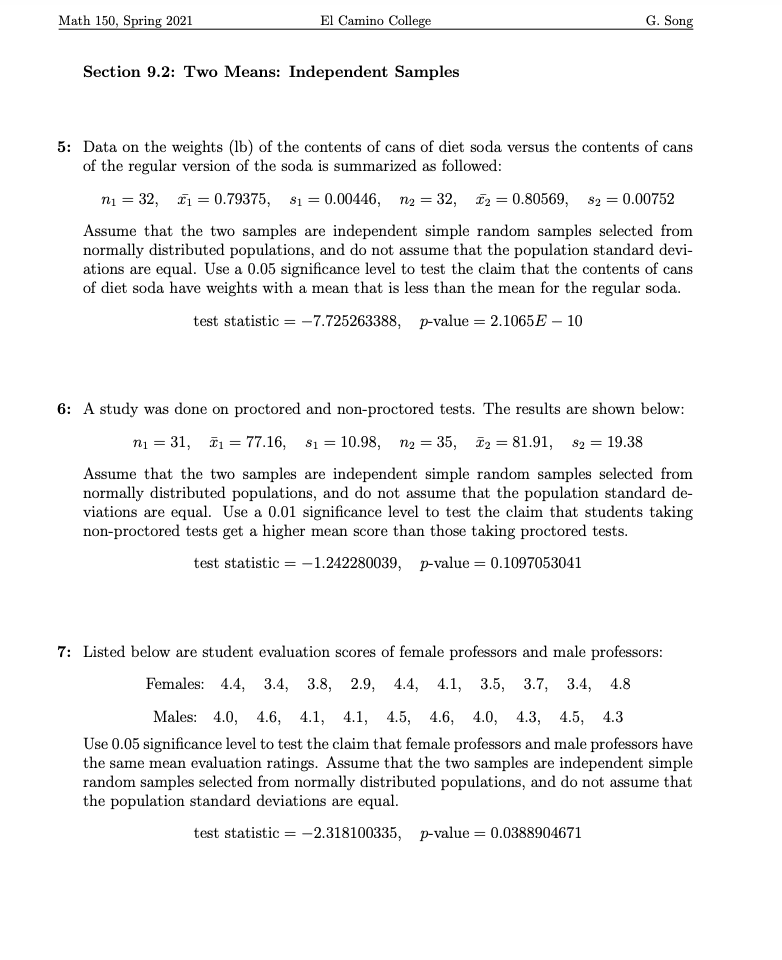
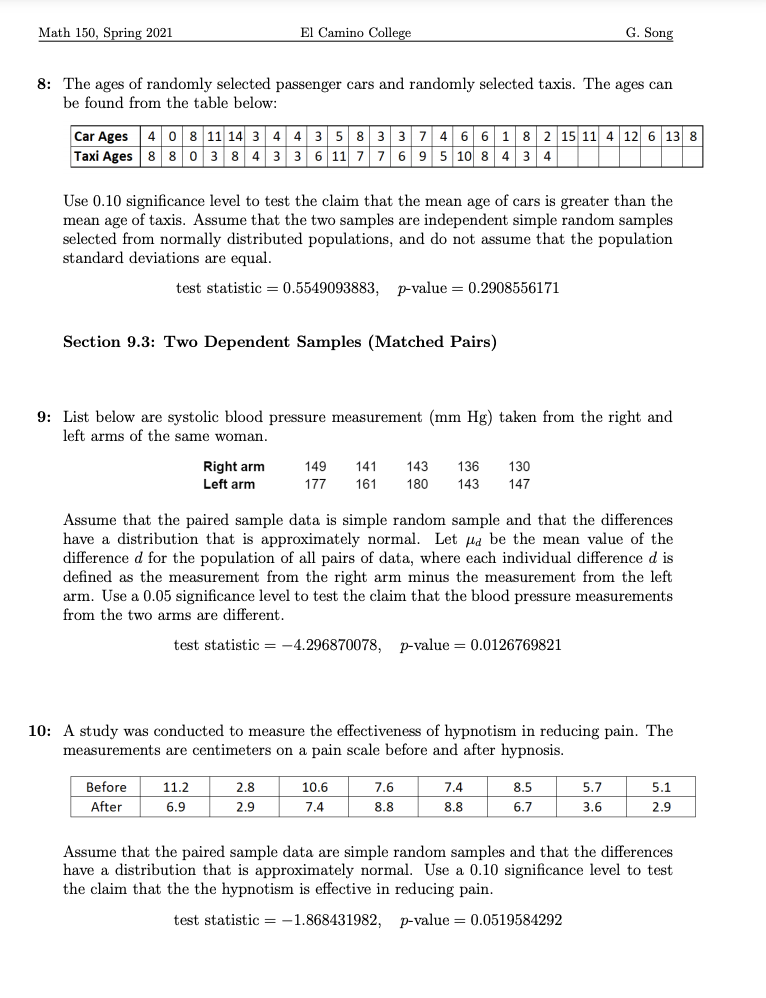
Math 150, Spring 2021 El Camino College G. Song Chapter 9: Worksheet Section 9.1: Two Proportions 1: A newspaper published an article about a study in which researchers subjected laboratory gloves to stress. Among 291 vinyl gloves, 56 of them leaked viruses. Among 291 latex gloves, 32 of them leaked viruses. Using a 0.01 significance level, test the claim that vinyl gloves have a greater virus leak rate than latex gloves. Let vinyl gloves be population 1. test statistic = 2.776949126, p-value = 0.00027436465 2: Among 2079 passenger cars in a particular region, 240 had only rear license plates. Among 384 commercial trucks, 54 had only rear license plates. A reasonable hypothesis is that commercial trucks owners violate laws requiring front license plates at a higher rate than owners of passenger cars. Use a 0.05 significance level to test that hypothesis. Identify the null and alternative hypothesis, test statistics, P-value, and state the final conclusion that addresses the original claim. test statistic = -1.398497151, p-value = 0.080981966 3: A study was conducted to determine the proportion of people who dream in black and white instead of color. Among 313 people over the age of 55, 68 dream in black and white, and among 314 people under the age of 25, 19 dream in black and white. Use a 0.01 significance level to test the claim that the proportion of people over 55 who dream in black and white is greater than the proportion for those under 25. test statistic = 5.676778827, p-value = 6.8821893E -9 1: Two different simple random samples are drawn from two different populations. The first sample consists of 40 people with 22 having a common attribute. The second sample consists of 2000 people with 1406 of the having the same common attribute. Use a 0.01 significance level to test the claim that the two populations has the same proportion with a common attribute. test statistic = -2.090796157, p-value = 0.0365462124Math 150, SE' 5 2021 El Caminu College G. Sung Section 9.2: Two Means: Independent Samples 5: Data on the weights (lb) of the contents of cans of diet soda versus the contents of cans of the regular version of the soda is summarized as followed: m = 32, '1 = 0.79375, 31 = 0.00446, M = 32, 2 = 0.80569, 32 = 0.00752 Assume that the two samples are independent simple random samples selected from normallg,r distributed populations, and do not assume that the population standard devi ations are equal. Use a 0.05 signicance level to test the claim that the contents of cans of diet soda have weights with a mean that is less than the mean for the regular soda. test statistic = 7.725283388, pvalue = 2.1065E 10 6: A study was done on proctored and nonproctored tests. The results are shown below: m = 31, i1 = 77.16, .51 = 10.98, M = 35, 2 = 81.91, a; = 19.38 Assume that the two samples are independent simple random samples selected from normallg,r distributed populations, and do not assume that the population standard de viations are equal. Use a 0.01 signicance level to test the claim that students taking nonproctored tests get a higher mean score than those taking proctored tests. test statistic = 1.242280039, pvalue = 01097053041 7: Listed below are student evaluation scores of female professors and male professors: Females: 4.4, 3.4, 3.8, 2.9, 4.4, 4.1, 3.5, 3.7, 3.4, 4.8 Males: 4.0, 4.6, 4.1, 4.1, 4.5, 4.6, 4.0, 4.3, 4.5, 4.3 Use 0.05 signicance level to test the claim that female professors and male professors have the same mean evaluation ratings. Assume that the two samples are independent simple random samples selected from normally distributed populations, and do not assume that the population standard deviations are equal. test statistic = 2.318100335, pvalue 2 00388904571 Math 150, Spring 2021 El Camino College G. Song 8: The ages of randomly selected passenger cars and randomly selected taxis. The ages can be found from the table below: Car Ages 4 0 8 11 14 3 4 4 3 5 8 3 3 7 4 6 6 1 8 2 15 11 4 12 6 13 8 Taxi Ages 8 8 0 3 8 4 3 3 6 11 7 7 6 9 5 10 8 4 3 4 Use 0.10 significance level to test the claim that the mean age of cars is greater than the mean age of taxis. Assume that the two samples are independent simple random samples selected from normally distributed populations, and do not assume that the population standard deviations are equal. test statistic = 0.5549093883, p-value = 0.2908556171 Section 9.3: Two Dependent Samples (Matched Pairs) 9: List below are systolic blood pressure measurement (mm Hg) taken from the right and left arms of the same woman. Right arm 149 141 143 136 130 Left arm 177 161 180 143 147 Assume that the paired sample data is simple random sample and that the differences have a distribution that is approximately normal. Let : be the mean value of the difference d for the population of all pairs of data, where each individual difference d is defined as the measurement from the right arm minus the measurement from the left arm. Use a 0.05 significance level to test the claim that the blood pressure measurements from the two arms are different. test statistic = -4.296870078, p-value = 0.0126769821 10: A study was conducted to measure the effectiveness of hypnotism in reducing pain. The measurements are centimeters on a pain scale before and after hypnosis. Before 11.2 2.8 10.6 7.6 7.4 8.5 5.7 5.1 After 6.9 2.9 7.4 8.8 8.8 6.7 3.6 2.9 Assume that the paired sample data are simple random samples and that the differences have a distribution that is approximately normal. Use a 0.10 significance level to test the claim that the the hypnotism is effective in reducing pain. test statistic = -1.868431982, p-value = 0.0519584292Math 150, Spring 2021 El Camino College G. Song 11: Refer to the data set in the accompanying table. Assume that the paired sample data is a simple random sample and the differences have a distribution that is approximately normal. Use a significance level of 0.05 to test for a difference between the weights of discarded paper (in pounds) and the weights of discarded plastic (in pounds) Household 1 2 3 4 5 6 7 8 9 10 11 12 13 14 Paper 11.08 8.82 11.42 17.65 6.83 9.45 2.80 16.39 7.72 6.16 16.08 14.33 9.83 3.27 15.09 Plastic 12.47 11.89 12.81 11.26 3.57 3.02 5.92 9.70 3.86 5.88 14.36 6.43 6.26 0.63 9.11 Household 16 17 18 19 20 21 22 23 24 25 26 27 28 29 30 Paper 11.36 6.05 12.32 7.57 13.61 6.67 20.12 13.05 13.31 7.98 8.72 6.33 6.38 9.55 13.73 Plastic 10.25 2.73 11.17 5.92 8.95 6.09 18.35 12.31 19.70 6.09 9.20 3.86 8.82 9.20 14.83 test statistic = -2.710389011, p-value = 0.011168914