

Question
I am new to SPSS and need to check my answers before I turn this in. My output is looking strange and I am not
I am new to SPSS and need to check my answers before I turn this in. My output is looking strange and I am not sure how to correct the error. Any assistance would be appreciated
Problem Set 3:
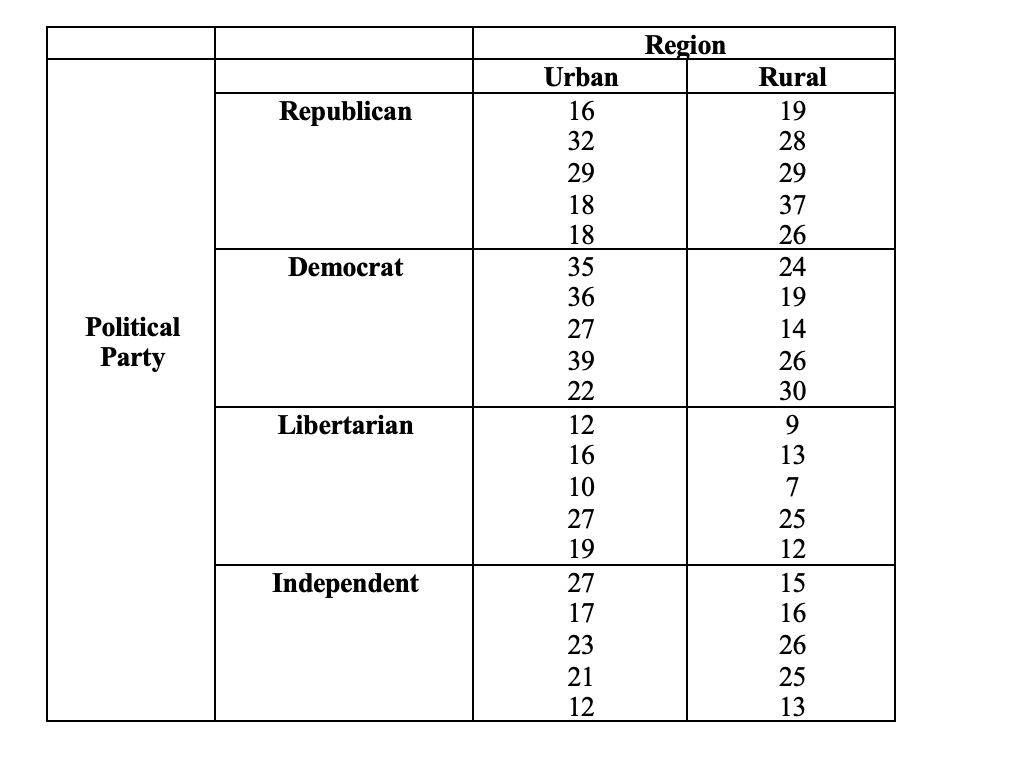
Research Scenario: In response to recent Gallup and Pew Center polls of Americans' trust in their political leaders, a political psychologist decides to study people's trust in politicians among different political parties and regions in his state. The psychologist administers a scale-level questionnaire with possible scores ranging from 1-50, with higher scores indicating higher trust in politicians, and lower scores indicating lower trust. The data from this scale-level questionnaire are shown in the table below. Is there a difference in mean trust scores between the different groups?
Using this table, enter the data into a new SPSS data file. Use the appropriate test to analyze the question and appropriate graph.
- Paste SPSS output.
- Results section based on your analysis including independent and dependent variables, confidence interval, effect size, 1 or 2 tailed and the p value.
Step by Step Solution
There are 3 Steps involved in it
Step: 1

Get Instant Access to Expert-Tailored Solutions
See step-by-step solutions with expert insights and AI powered tools for academic success
Step: 2

Step: 3
Ace Your Homework with AI
Get the answers you need in no time with our AI-driven, step-by-step assistance
Get Started
Calculus Early Transcendentals
Authors: James Stewart
7th edition
538497904, 978-0538497909