

Question
I am not understanding how to find the answers to these questions. I completed the scatterplots and graphs in SPSS but am unsure of where
I am not understanding how to find the answers to these questions. I completed the scatterplots and graphs in SPSS but am unsure of where to go next. I do NOT want to use your answers as my answers, I just need guidance on how to answer them and what I'm looking for
An overview of the data set:
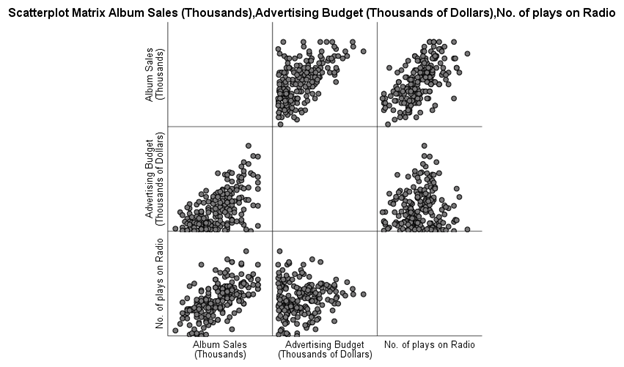
This data set contains data for 200 different rock albums (i.e., each row in the data set represents the data for one album). Specifically, the following variables are included:
AlbumNumber: This is the ID number of the album. There are 200 albums, so this variable ranges from 1 to 200.
RecordCompany: This is the record company that promoted the album. Values of "1" stand for Next Generation Records, and values of "2" stand for Worldwide Entertainment.
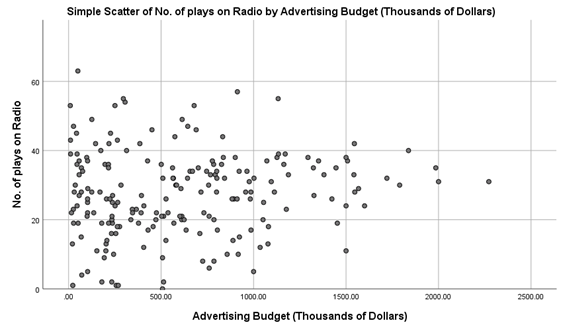
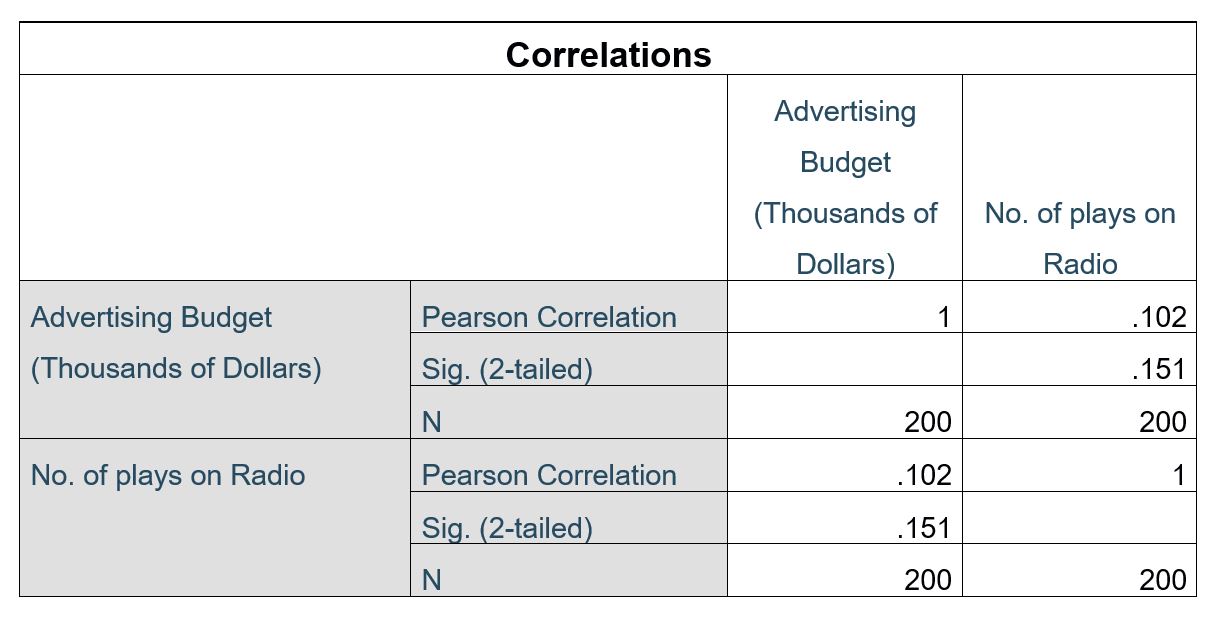
Adverts: This is the advertising budget of the album. The values are in thousands of dollars.
Sales: These are the sales of the album. The values are in thousands of sales.
Airplay: This is the number of times that the album was played on the radio in the last year.
Attract: This is the overall physical attractiveness of the band as rated by independent raters. The values for this variable range from 1 to 10.
Questions:
Here is a scatterplot to examine the relationship between Adverts and Airplay.


Step by Step Solution
There are 3 Steps involved in it
Step: 1

Get Instant Access to Expert-Tailored Solutions
See step-by-step solutions with expert insights and AI powered tools for academic success
Step: 2

Step: 3
Ace Your Homework with AI
Get the answers you need in no time with our AI-driven, step-by-step assistance
Get Started
Measure Theory And Integration
Authors: M M Rao, MM Rao
2nd Edition
1351991485, 9781351991483