I am only need the last part and recommendation please Case 2 - Gage St. Retirement Home Gage St. Retirement Home is trying to improve
I am only need the last part and recommendation please
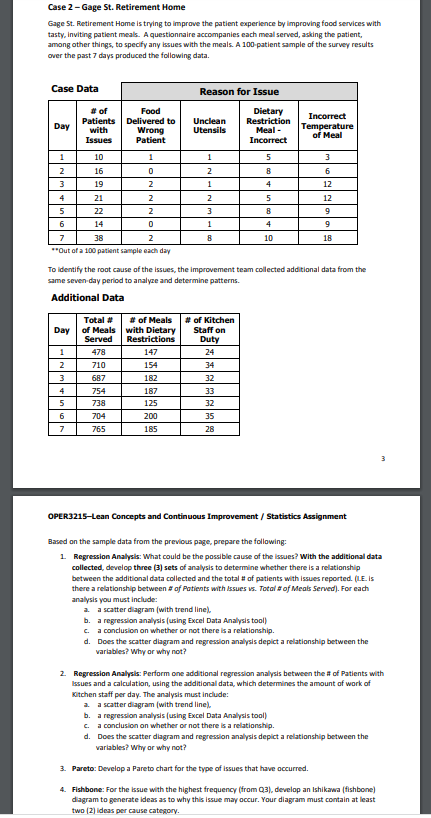
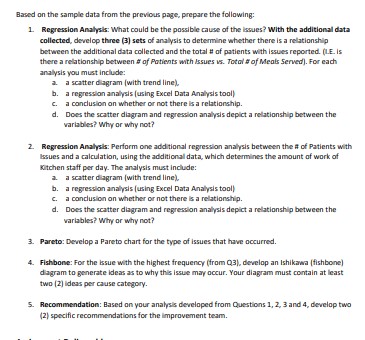
Case 2 - Gage St. Retirement Home Gage St. Retirement Home is trying to improve the patient experience by improving food services with tasty, Inviting patient meals. A questionnaire accompanies each meal served, asking the patient, among other things, to specify any Issues with the meals. A 100 patient sample of the survey results over the past 7 days produced the following data. Case Data Reason for Issue # of Food Patients Incorrect Day Temperature of Meal W 12 12 9 To identify the root cause of the issues, the Improvement team collected additional data from the same seven day period to analyze and determine patterns. Additional Data Total # # of Meals # of Kitchen Day of Meals with Dietary Staff on Served Restrictions Duty 1 478 147 24 2 710 154 34 3 687 182 32 754 187 33 738 125 32 6 704 200 35 7 765 185 3 OPER3215-Lean Concepts and Continuous Improvement / Statistics Assignment Based on the sample data from the previous page, prepare the following: 1. Regression Analysis: What could be the possible cause of the issues? With the additional data collected, develop three (3) sets of analysis to determine whether there is a relationship between the additional data collected and the total # of patients with issues reported. (LE. Is there a relationship between # of Patients with Issues vs. Totol # of Meals Served). For each analysis you must include: a. a scatter diagram (with trend line), b. a regression analysis (using Excel Data Analysis tool) c. a conclusion on whether or not there is a relationship. d. Does the scatter diagram and regression analysis depict a relationship between the warlables? Why or why not?' 2. Regression Analysis: Perform one additional regression analysis between the # of Patients with Issues and a calculation, using the additional data, which determines the amount of work of Kitchen staff per day. The analysis must include: a. a scatter diagram (with trend line), b. a regression analysis (using Excel Data Analysis tool) c. a conclusion on whether or not there is a relationship. d. Does the scatter diagram and regression analysis depict a relationship between the variables? Why or why not? 3. Pareto: Develop a Pareto chart for the type of issues that have occurred. 4. Fishbone: For the Issue with the highest frequency (from Q3), develop an Ishikawa (fishbone] diagram to generate ideas as to why this issue may occur. Your diagram must contain at least two [2) ideas per cause category.Based on the sample data from the previous page, prepare the following: 1. Regression Analysis: What could be the possible cause of the lasues?' With the additional data collected, develop three (3] sets of analysis to determine whether there is a relationship between the additional data collected and the total # of patients with issues reported. (LE. Is there a relationship between # of Patients with Issues is. Totol # of Meals Served). For each analysis you must include: a. a scatterdiagram (with trend line), b. a regression analysis [using Excel Data Analysis tool) c. a conclusion on whether or not there is a relationship. d. Does the scatter diagram and regression analysis depict a relationship between the warlables? Why or why not? 2. Regression Analysis: Perform one additional regression analysis between the # of Patients with Issues and a calculation, using the additional data, which determines the amount of work of Kitchen staff per day. The analysis must include: a. a scatter diagram (with trend line). b. a regression analysis (using Excel Data Analysis tool) C. a conclusion on whether or not there is a relationship. d. Does the scatter diagram and regression analysis depict a relationship between the warlables? Why or why not? 3. Pareto: Develop a Pareto chart for the type of issues that have occurred. 4. Fishbone: For the Issue with the highest frequency (from Q3). develop an Ishikawa (fishbone] diagram to generate ideas as to why this issue may occur. Your diagram must contain at least two [2] Ideas per cause category. 5. Recommendation: Based on your analysis developed from Questions 1, 2, 3 and 4, develop two (2) specific recommendations for the Improvement team
Step by Step Solution
There are 3 Steps involved in it
Step: 1
Get Instant Access to Expert-Tailored Solutions
See step-by-step solutions with expert insights and AI powered tools for academic success
Step: 2
Step: 3
Ace Your Homework with AI
Get the answers you need in no time with our AI-driven, step-by-step assistance