Question: I am really only interested in the steps. Building a Tech nical Support Data Dashboard . Bogdans Express, a chain of sporting goods stores in
I am really only interested in the steps.
Building a Tech nical Support Data Dashboard. Bogdans Express, a chain of sporting goods stores in Washington, wants to construct a tech nical support data dashboard to monitor how effectively its tech nical support group deals with I T problems. Management is primarily interested in the time it takes the I T support group to respond once a problem has been reported (response time) and how long it takes the group to resolve the issue after the initial response by the I T support group (time to resolution) over the most recent four months. They would like to be able to review the I T groups performance by date, type of tech nical problem (email, hardware, or internet), and office (Bellingham, Olympia, Seattle, or Spokane).
Each reported problem is immediately logged and issued a case number, and the data collected by Bogdan from its relational database includes the case number, date, office, type of tech nical problem, response time (in minutes), and time to resolution (in minutes). They have also created a new field for the month during which the problem was reported. Note that both Response Time and Time to Resolution only include time that elapses during normal business hours.
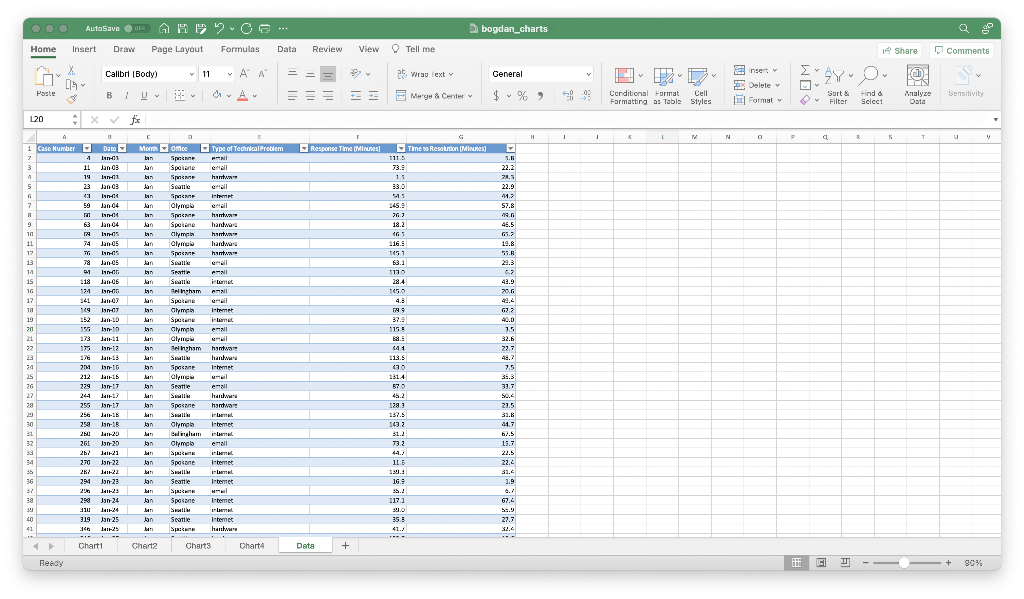
Bogdans staff has already created the following components for the data dashboard in Excel. LO 6
-
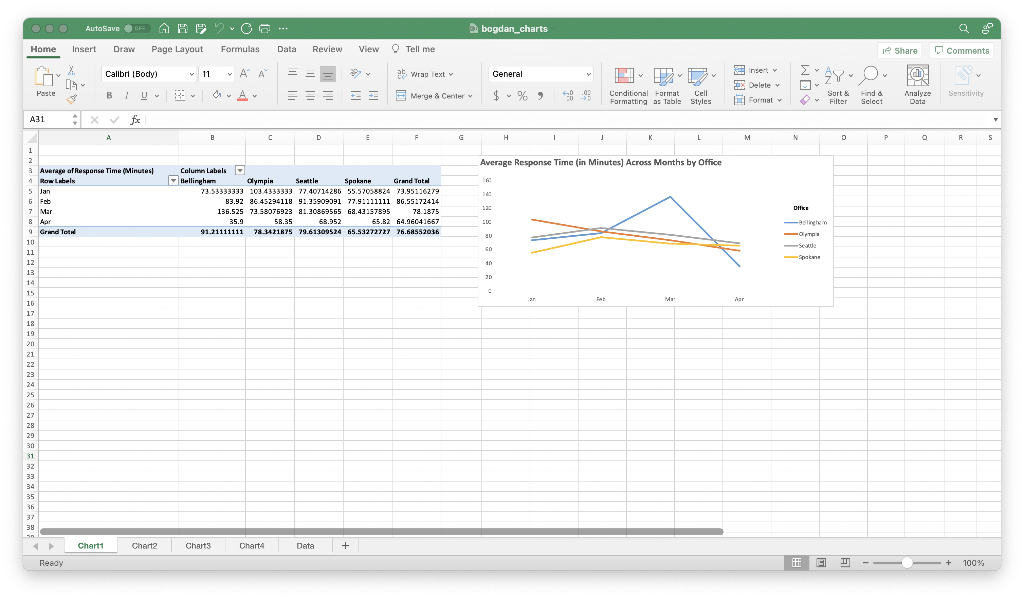
A line chart of average response time across months by office (in the Chart1 worksheet)
-
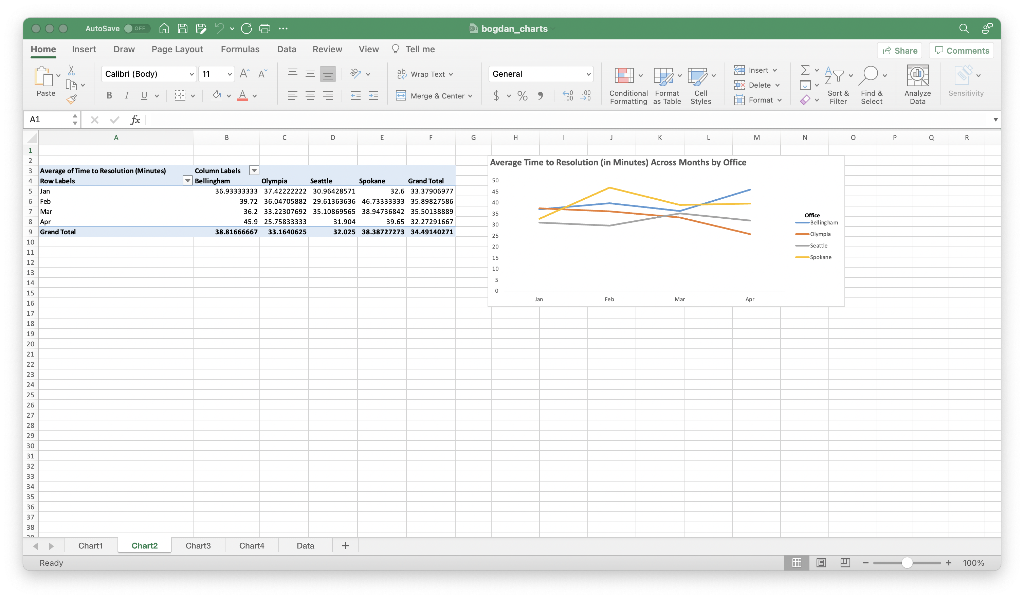
A line chart of average time to resolution across months by office (in the Chart2 worksheet)
-
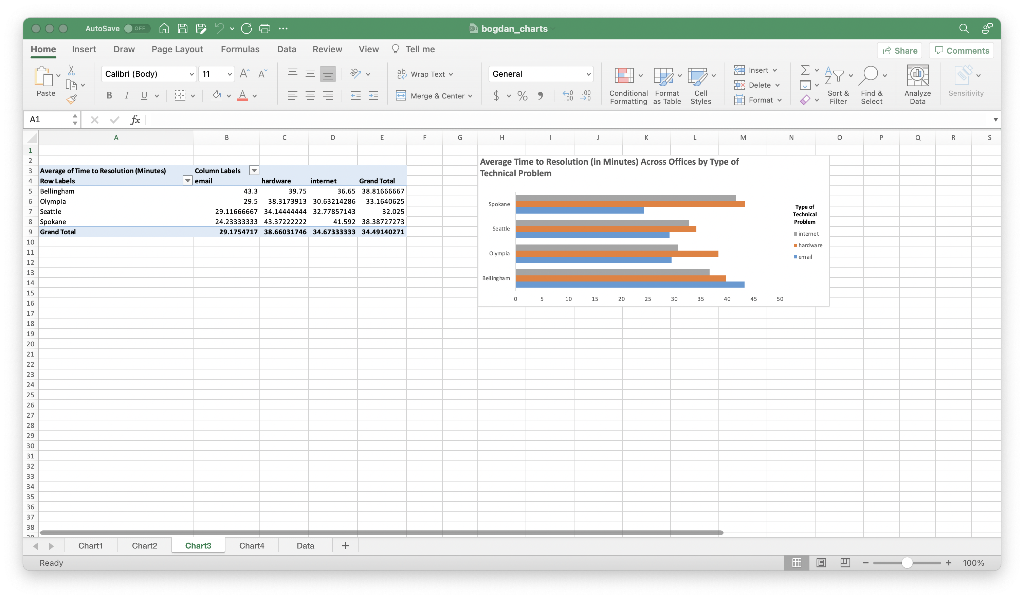
A clustered bar chart of average time to resolution across offices by type of tech nical problem (in the Chart3 worksheet)
-
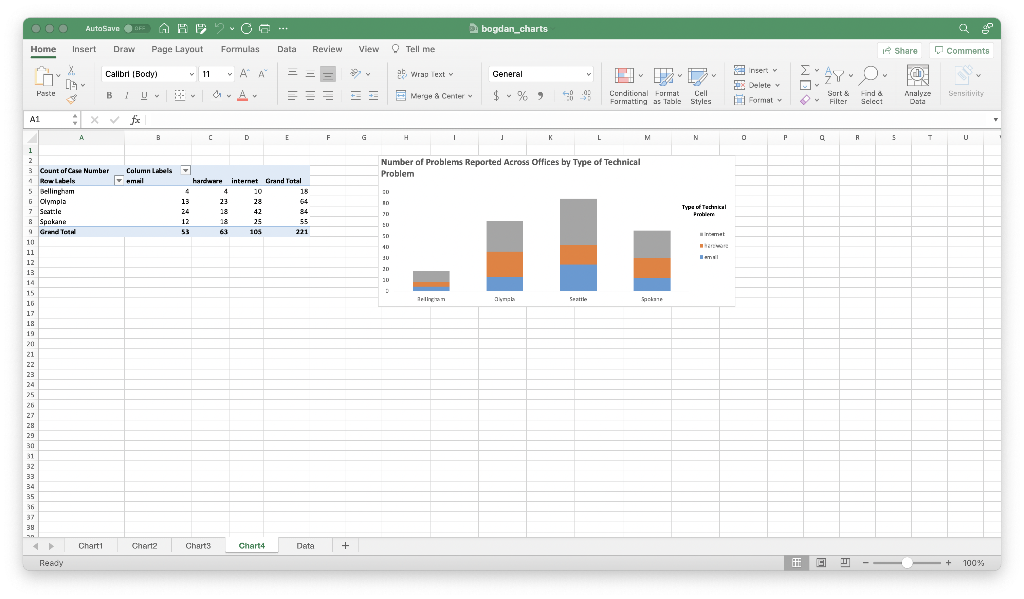
A stacked cluster column chart of number of problems reported across office by type of tech nical problem (in the Chart4 worksheet)
The data and these charts are available in the file Bogdan Charts, and the name of the worksheet in which each chart can be found is given with the descriptions of the charts Bogdan has developed.
-
Create the following slicers for the charts created by Bogdan.
-
A slicer for month and a slicer for office for the chart in the Chart1 worksheet
-
A slicer for month and a slicer for office for the chart in the Chart2 worksheet
-
A slicer for office and a slicer for type of tech nical problem for the chart in the Chart3 worksheet
-
A slicer for office and a slicer for type of tech nical problem for the chart in the Chart4 worksheet
-
Create the data dashboard by creating a new worksheet and naming it Dashboard; moving the charts and slicers from the Chart1, Chart2, Chart3, and Chart4 worksheets to the Dashboard worksheet; repositioning these charts and slicers on the Dashboard worksheet; and adding a title to the dashboard and doing whatever formatting and editing is necessary to make the dashboard functional and visually appealing.
-
Amend the data dashboard you created in part b in the following ways.
-
Create a single slicer to filter month for the charts created in the Chart1 and Chart2 worksheets
-
Create a single slicer to filter office for the charts created in the Chart1, Chart2, Chart3, and Chart4 worksheets
-
Create a slicer to filter type of tech nical problem for the charts created in the Chart3 and Chart4 worksheets
Once you have amended the data dashboard, rearrange the charts and slicers to create an effective and visually appealing dashboard. Test each slicer to ensure it works on the appropriate charts.
-
Protect the data dashboard in part c from being revised by users. Ensure that the slicers cannot be resized or moved, password protect the Dashboard worksheet (use the password Problem820), and hide all worksheets except the Dashboard worksheet.
-
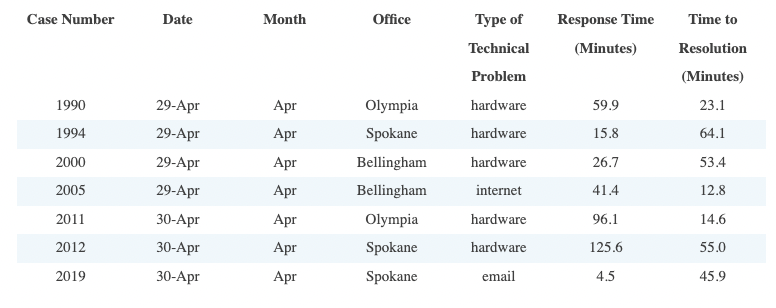
The following seven entries for April 2930 in the following table were not logged. Add these data to the Bogdan Data table and refresh all PivotTables and PivotCharts. Comment on differences between the resulting dashboard and the dashboard from part d.
I cant clear graph data as this is how the problem is set up
AutoSave OH bogdan_charts 0 Home Insert Draw Page Layout Formulas Data Review View Tell me Share Comments Calibri Body) x LA AA 11 a wrap lext nsert General AYO d W ME Paste B U A = = Merge & Center $ % % 4003 0 2 Delele Formal Conditional Format Cell Formatting as Table Styles Surt & Filter Find a Select Analyze Data Sensitivity A31 x A B C D F G H 1 1 K L M N o P 0 o R 5 1 Average Response Time (in Minutes) Across Months by Office Column Labels Bellingham Olympia Seattle Spokane Grand Total 73.53333333 103.4333333 77.40714286 55.57058524 73.95126279 33.92 26.45294118 91.35909091 77.92111111 86.55.72414 136.525 73.58075923 21.20859555 68.43157395 78. 1875 35.9 58.35 63.252 65.B2 64.96041657 91.21111111 78.3421875 79.61300524 65.59272727 76.69552036 Othe SUC -alight - 20 3 Average of Response Time (Minutes! 1 Roer Labels 5 Jan G Feb 7 Mar 8 Apr Grand Tot 10 11 12 13. 15 14 15 16 17 18 19 30 - 10 20 PAD M dar 20 21 22 23 24 25 26 27 28 29 30 31 32 33 34 35 36 37 2 38 SA Chart1 Chart2 Charts Chart4 Data + + Ready itit 1 - C + 100% AutoSave OF bogdan_charts 0 Home Insert Draw Page Layout Formulas Data Review View Tell me Share Comments Calibri Body) AA 11 General nsert a Wrap lext AY-0. d NE Delete Paste BU dv A = Merge & Center $ % % 4003 0 Conditional Format Cell Formatting as Table Styles Sort & Filter Formal Find & Select Analyze Data Sensitivity A1 A E C D E F 5 H L M N P O R 1 Average Time to Resolution (in Minutes) Across Months by Office 90 45 Column Labels Bellingham Olympia Seattle Spokane Grand Tour 36.93333333 37.42222222 30.95428571 32.6 33.37906977 39.72 35.04705992 29.51363G3G 46.73333333 35.895275BG 36.2 33.22307692 35.10869SGS 2894736842 35.50133889 45.9 25.75833333 31.904 39.65 32.27201667 3R.61666667 33.1640625 32.025 98.38727279 94.49140271 OM 35 30 ellen - 21 3 Average of Time to Resolution (Minutes 1 Row Labels 5 Jan G Feb 7 Mar 8 Apr Grand Tot 10 11 12 13 14 15 16 17 18 19 19 Pasku 13 3 Feh Na 20 21 22 23 24 25 2h 27 28 29 30 31 32 33 34 35 3h 37 38 an Charti Chart2 Charts Chart Data + + Ready CI - + 100% AutoSave OF bogdan_charts 0 Home Insert Draw Page Layout Formulas Data Review View Tell me Share Comments Calibri Body) AA 11 a Wrap lext General Insert DX Delete AY-0. Paste BU dv A = Merge & Center $ % % A. 0 Conditional Format Cell Formatting as Table Styles Sort & Filter Sensitivity Formal Find a Select Analyze Data A1 x fe A E D G H 1 L M R S 1 Average Time to Resolution (In Minutes) Across Offices by Type of Technical Problem 3 Average of Time to Resolution (Minutes 1 Row labels 5 Bellingham 6 Olympia 7 Seattle & Spakana Grand Todd 10 11 12 13 14 15 Column Labels email hardware intemet Crund Totul 433 39.75 36.65 38 81666667 29.5 35.3173913 30.5321429G 33.1540625 29.116GGEET 34.14444444 32.77857143 32.025 24.23333333 43.37222222 41.592 38 38727273 29.1754717 38.66031746 34.67333399 34.40140271 Spoona Salle Treat Technical Problem lans tam abs 0 15 2D 25 3 35 45 50 16 17 18 19 20 21 22 23 24 25 26 27 28 29 30 31 32 33 34 35 ih 37 38 Charti Chart2 Charts Chart4 Data + it CI Ready + 100% AutoSave OF bogdan_charts 0 Home Insert Draw Page Layout Formulas Data Review View Tell me Share Comments Calibrl Body) 11 AA General a Wrap lext Insert AYO # d W ME Paste BU A = Merge & Cerver $ % 4003 0 . Conditional Format Cell Formatting as Table Styles Delete Formal Surt & Filter Find a Select Analyze Data Sensitivity A1 fx A B B C D E F G 1 I K L N N 0 P Q R 5 T U 1 1 Number of Problems Reported Across Offices by Type of Technical Problem hardwww internet Grand Total 4 4 4 30 15 13 23 28 24 18 42 84 12 18 25 55 53 63 105 221 SD 10 Type of Technical Problem 30 3 Count of Case Number Column Labels 1 RowLabels email 5 Bellingham 5 Olympia 7 Seattle & Spakana Grand Tot 10 11 12 13 14 15 EU 50 nomat 10 90 Lan 20 20 . Town abs Seattle 16 17 18 19 20 21 22 23 24 25 26 27 28 29 30 31 32 33 34 35 3h 37 38 an Chart1 Chart2 Charts Chart4 Data + Ready itit El + 100% Case Number Date Month Office Time to Response Time (Minutes) Resolution (Minutes) Type of Technical Problem hardware hardware hardware 29-Apr 23.1 1990 1994 Apr Apr 59.9 15.8 29-Apr 64.1 2000 26.7 53.4 29-Apr 29-Apr Olympia Spokane Bellingham Bellingham Olympia Spokane 2005 41.4 12.8 2011 Apr Apr Apr Apr Apr internet hardware hardware 30-Apr 30-Apr 96.1 14.6 2012 125.6 55.0 2019 30-Apr Spokane email 4.5 45.9 AutoSave OF AHOO. bogdan_charts 0 Home Insert Draw Page Layout Formulas Data Review View Tell me Share m Comments Calibri Body) 11 MAA a Wrap lext General Insert X Delete AYO d LA UNE Paste BU . du A + + Merge & Center A 93 Conditional Format Cell Formatting as Table Styles Sort & Filter Formal Find a Select Analyze Data Sensitivity L20 x T H1 1 1 N a R T u Response Time (Minnes Time to Resolution Minutes) 111.5 73. 1.5 33.0 5.5 22.2 21.1 22.9 91.2 57.8 119.6 45.5 19.8 145. 763 18.2 46 116.5 151 53.1 1170 28.4 50 42.9 20,6 11 1 Case Number Dato Merreomice Type of Technical Problem - 2 4 Lan! ban Spen 3 11 Jan 03 Sn Spolan email 4 19 LATHIL ban Spaan hann 5 23 Jan 02 n Senk email G 41 Lan-31 ban Ihmet 7 59 Jan 04 Jan Olmos email Land ban Spokane 5 humta 9 3 63 Jan 04 jan Spelene hande in 14 Indsban Clympia hama 11 74 Jan 05 jan Olpe hard 12 76 Lan- ban Spokane hana 13 78 Jan 05 lar Selle em 1.4 91 ban Seatti 15 318 Jan-06 an Swalle imet 16 24 land ban Balinham 17 141 Jan-07 jan Specene 18 19 land T ban Olympla I-hemmet 19 352 Jan-10 Spelene 20 lan 10 ban Olympo hall 173 Jan-11 lan arres Olympia 22 175 Lanan Balingham handwa 23 Jan-13 dan Swi hancher 24 2014 16 ban Smerne I-themet da 212 Jante JAS Olymp 2G 229 larr bon mall Seattle 22 244 Jan-17 Small hartha 29 256 lan 17 Lr17 ban Sporane handwa 256 Jan-18 Swall 30 LIB ban br Olympla I-temet 31 250 Jun20 Lan Bedingum ilmal 32 26 Jan 20 on Olmaba email 33 257 JA21 Scene 34 270 Jan 22 lan Spokane Iemet 35 267 J2 M Swall i- 36 224 Jan 24 lan Seattle Iemet 52 200 Ji23 SR 38 258 Jan 24 ban Spotone Irtemet su 110 JIK24 an Swali 40 319 Jan 25 bon Seattle Iemet 41 14 JIK25 Space hanhwa 37.. 115 8. 441 113.5 439 131.4 570 45.2 1283 137.5 1432 31.2 733 44.2 11.3 130.3 16.5 62.2 40.0 15 2.5 32.6 23.7 49.7 7.5 35.3 33.7 50.4 23.5 31.8 41.7 67.5 15.7 22.5 22.2 31.4 1.9 117.1 30.0 35.5 41.2 67.4 53.9 27.7 2.4 Charti Chart2 Charts Chart4 Data + Ready itit CI + 80% AutoSave OH bogdan_charts 0 Home Insert Draw Page Layout Formulas Data Review View Tell me Share Comments Calibri Body) x LA AA 11 a wrap lext nsert General AYO d W ME Paste B U A = = Merge & Center $ % % 4003 0 2 Delele Formal Conditional Format Cell Formatting as Table Styles Surt & Filter Find a Select Analyze Data Sensitivity A31 x A B C D F G H 1 1 K L M N o P 0 o R 5 1 Average Response Time (in Minutes) Across Months by Office Column Labels Bellingham Olympia Seattle Spokane Grand Total 73.53333333 103.4333333 77.40714286 55.57058524 73.95126279 33.92 26.45294118 91.35909091 77.92111111 86.55.72414 136.525 73.58075923 21.20859555 68.43157395 78. 1875 35.9 58.35 63.252 65.B2 64.96041657 91.21111111 78.3421875 79.61300524 65.59272727 76.69552036 Othe SUC -alight - 20 3 Average of Response Time (Minutes! 1 Roer Labels 5 Jan G Feb 7 Mar 8 Apr Grand Tot 10 11 12 13. 15 14 15 16 17 18 19 30 - 10 20 PAD M dar 20 21 22 23 24 25 26 27 28 29 30 31 32 33 34 35 36 37 2 38 SA Chart1 Chart2 Charts Chart4 Data + + Ready itit 1 - C + 100% AutoSave OF bogdan_charts 0 Home Insert Draw Page Layout Formulas Data Review View Tell me Share Comments Calibri Body) AA 11 General nsert a Wrap lext AY-0. d NE Delete Paste BU dv A = Merge & Center $ % % 4003 0 Conditional Format Cell Formatting as Table Styles Sort & Filter Formal Find & Select Analyze Data Sensitivity A1 A E C D E F 5 H L M N P O R 1 Average Time to Resolution (in Minutes) Across Months by Office 90 45 Column Labels Bellingham Olympia Seattle Spokane Grand Tour 36.93333333 37.42222222 30.95428571 32.6 33.37906977 39.72 35.04705992 29.51363G3G 46.73333333 35.895275BG 36.2 33.22307692 35.10869SGS 2894736842 35.50133889 45.9 25.75833333 31.904 39.65 32.27201667 3R.61666667 33.1640625 32.025 98.38727279 94.49140271 OM 35 30 ellen - 21 3 Average of Time to Resolution (Minutes 1 Row Labels 5 Jan G Feb 7 Mar 8 Apr Grand Tot 10 11 12 13 14 15 16 17 18 19 19 Pasku 13 3 Feh Na 20 21 22 23 24 25 2h 27 28 29 30 31 32 33 34 35 3h 37 38 an Charti Chart2 Charts Chart Data + + Ready CI - + 100% AutoSave OF bogdan_charts 0 Home Insert Draw Page Layout Formulas Data Review View Tell me Share Comments Calibri Body) AA 11 a Wrap lext General Insert DX Delete AY-0. Paste BU dv A = Merge & Center $ % % A. 0 Conditional Format Cell Formatting as Table Styles Sort & Filter Sensitivity Formal Find a Select Analyze Data A1 x fe A E D G H 1 L M R S 1 Average Time to Resolution (In Minutes) Across Offices by Type of Technical Problem 3 Average of Time to Resolution (Minutes 1 Row labels 5 Bellingham 6 Olympia 7 Seattle & Spakana Grand Todd 10 11 12 13 14 15 Column Labels email hardware intemet Crund Totul 433 39.75 36.65 38 81666667 29.5 35.3173913 30.5321429G 33.1540625 29.116GGEET 34.14444444 32.77857143 32.025 24.23333333 43.37222222 41.592 38 38727273 29.1754717 38.66031746 34.67333399 34.40140271 Spoona Salle Treat Technical Problem lans tam abs 0 15 2D 25 3 35 45 50 16 17 18 19 20 21 22 23 24 25 26 27 28 29 30 31 32 33 34 35 ih 37 38 Charti Chart2 Charts Chart4 Data + it CI Ready + 100% AutoSave OF bogdan_charts 0 Home Insert Draw Page Layout Formulas Data Review View Tell me Share Comments Calibrl Body) 11 AA General a Wrap lext Insert AYO # d W ME Paste BU A = Merge & Cerver $ % 4003 0 . Conditional Format Cell Formatting as Table Styles Delete Formal Surt & Filter Find a Select Analyze Data Sensitivity A1 fx A B B C D E F G 1 I K L N N 0 P Q R 5 T U 1 1 Number of Problems Reported Across Offices by Type of Technical Problem hardwww internet Grand Total 4 4 4 30 15 13 23 28 24 18 42 84 12 18 25 55 53 63 105 221 SD 10 Type of Technical Problem 30 3 Count of Case Number Column Labels 1 RowLabels email 5 Bellingham 5 Olympia 7 Seattle & Spakana Grand Tot 10 11 12 13 14 15 EU 50 nomat 10 90 Lan 20 20 . Town abs Seattle 16 17 18 19 20 21 22 23 24 25 26 27 28 29 30 31 32 33 34 35 3h 37 38 an Chart1 Chart2 Charts Chart4 Data + Ready itit El + 100% Case Number Date Month Office Time to Response Time (Minutes) Resolution (Minutes) Type of Technical Problem hardware hardware hardware 29-Apr 23.1 1990 1994 Apr Apr 59.9 15.8 29-Apr 64.1 2000 26.7 53.4 29-Apr 29-Apr Olympia Spokane Bellingham Bellingham Olympia Spokane 2005 41.4 12.8 2011 Apr Apr Apr Apr Apr internet hardware hardware 30-Apr 30-Apr 96.1 14.6 2012 125.6 55.0 2019 30-Apr Spokane email 4.5 45.9 AutoSave OF AHOO. bogdan_charts 0 Home Insert Draw Page Layout Formulas Data Review View Tell me Share m Comments Calibri Body) 11 MAA a Wrap lext General Insert X Delete AYO d LA UNE Paste BU . du A + + Merge & Center A 93 Conditional Format Cell Formatting as Table Styles Sort & Filter Formal Find a Select Analyze Data Sensitivity L20 x T H1 1 1 N a R T u Response Time (Minnes Time to Resolution Minutes) 111.5 73. 1.5 33.0 5.5 22.2 21.1 22.9 91.2 57.8 119.6 45.5 19.8 145. 763 18.2 46 116.5 151 53.1 1170 28.4 50 42.9 20,6 11 1 Case Number Dato Merreomice Type of Technical Problem - 2 4 Lan! ban Spen 3 11 Jan 03 Sn Spolan email 4 19 LATHIL ban Spaan hann 5 23 Jan 02 n Senk email G 41 Lan-31 ban Ihmet 7 59 Jan 04 Jan Olmos email Land ban Spokane 5 humta 9 3 63 Jan 04 jan Spelene hande in 14 Indsban Clympia hama 11 74 Jan 05 jan Olpe hard 12 76 Lan- ban Spokane hana 13 78 Jan 05 lar Selle em 1.4 91 ban Seatti 15 318 Jan-06 an Swalle imet 16 24 land ban Balinham 17 141 Jan-07 jan Specene 18 19 land T ban Olympla I-hemmet 19 352 Jan-10 Spelene 20 lan 10 ban Olympo hall 173 Jan-11 lan arres Olympia 22 175 Lanan Balingham handwa 23 Jan-13 dan Swi hancher 24 2014 16 ban Smerne I-themet da 212 Jante JAS Olymp 2G 229 larr bon mall Seattle 22 244 Jan-17 Small hartha 29 256 lan 17 Lr17 ban Sporane handwa 256 Jan-18 Swall 30 LIB ban br Olympla I-temet 31 250 Jun20 Lan Bedingum ilmal 32 26 Jan 20 on Olmaba email 33 257 JA21 Scene 34 270 Jan 22 lan Spokane Iemet 35 267 J2 M Swall i- 36 224 Jan 24 lan Seattle Iemet 52 200 Ji23 SR 38 258 Jan 24 ban Spotone Irtemet su 110 JIK24 an Swali 40 319 Jan 25 bon Seattle Iemet 41 14 JIK25 Space hanhwa 37.. 115 8. 441 113.5 439 131.4 570 45.2 1283 137.5 1432 31.2 733 44.2 11.3 130.3 16.5 62.2 40.0 15 2.5 32.6 23.7 49.7 7.5 35.3 33.7 50.4 23.5 31.8 41.7 67.5 15.7 22.5 22.2 31.4 1.9 117.1 30.0 35.5 41.2 67.4 53.9 27.7 2.4 Charti Chart2 Charts Chart4 Data + Ready itit CI + 80%


