Answered step by step
Verified Expert Solution
Question
1 Approved Answer
I am really struggling on how to start. I don't need it all filled out. Just enough to get me going. thank you. You have


I am really struggling on how to start. I don't need it all filled out. Just enough to get me going. thank you.
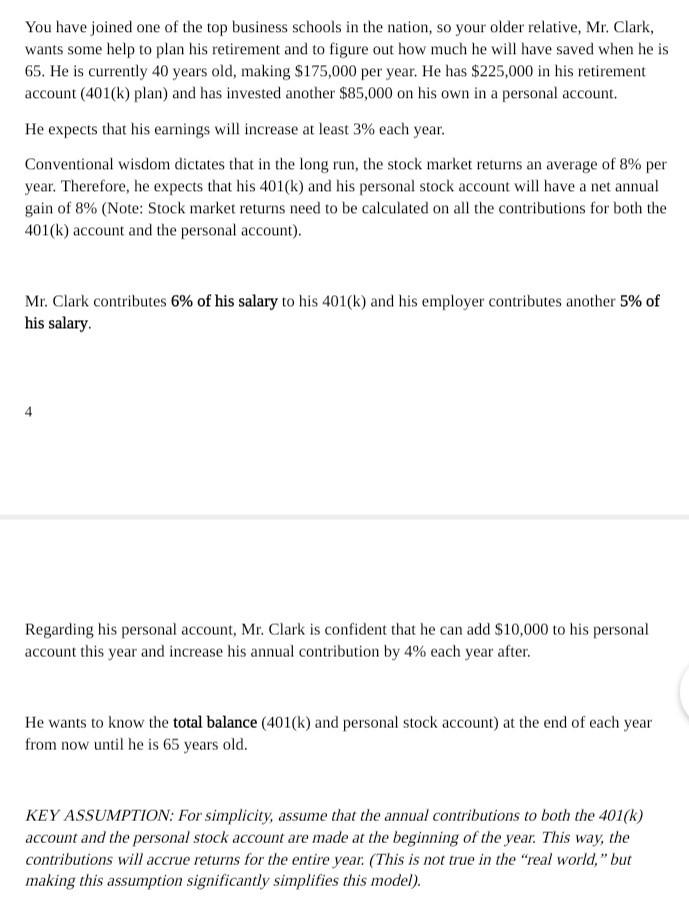
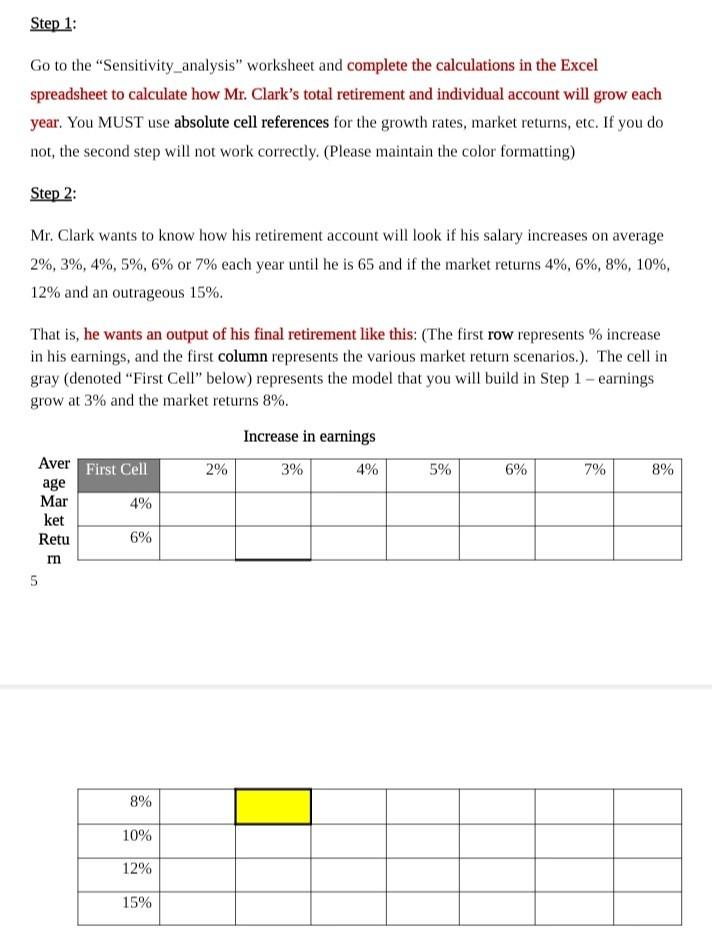
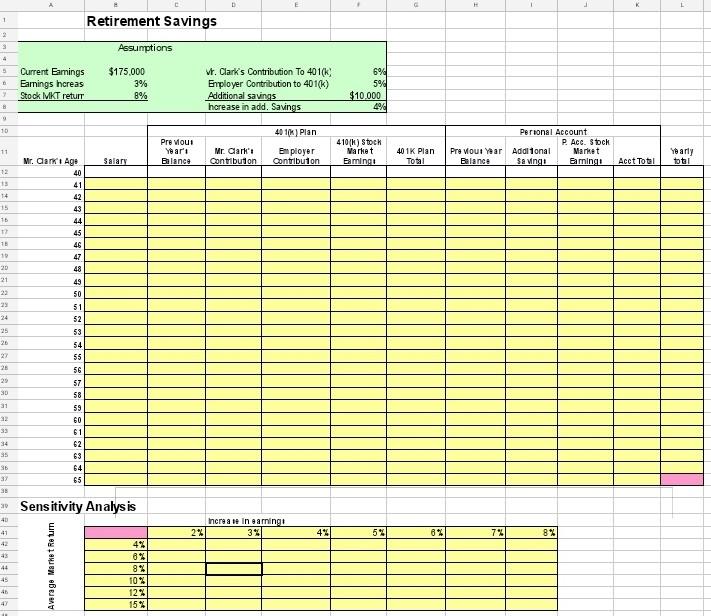
You have joined one of the top business schools in the nation, so your older relative, Mr. Clark, wants some help to plan his retirement and to figure out how much he will have saved when he is 65. He is currently 40 years old, making $175,000 per year. He has $225,000 in his retirement account (401(k) plan) and has invested another $85,000 on his own in a personal account. He expects that his earnings will increase at least 3% each year. Conventional wisdom dictates that in the long run, the stock market returns an average of 8% per year. Therefore, he expects that his 401(k) and his personal stock account will have a net annual gain of 8% (Note: Stock market returns need to be calculated on all the contributions for both the 401(k) account and the personal account). Mr. Clark contributes 6% of his salary to his 401(k) and his employer contributes another 5% of his salary. Regarding his personal account, Mr. Clark is confident that he can add $10,000 to his personal account this year and increase his annual contribution by 4% each year after. He wants to know the total balance (401(k) and personal stock account) at the end of each year from now until he is 65 years old. KEY ASSUMPTION: For simplicity, assume that the annual contributions to both the 401(k) account and the personal stock account are made at the beginning of the year. This way, the contributions will accrue returns for the entire year. (This is not true in the real world," but making this assumption significantly simplifies this model). Step 1: Go to the "Sensitivity analysis" worksheet and complete the calculations in the Excel spreadsheet to calculate how Mr. Clark's total retirement and individual account will grow each year. You MUST use absolute cell references for the growth rates, market returns, etc. If you do not, the second step will not work correctly. (Please maintain the color formatting) Step 2: Mr. Clark wants to know how his retirement account will look if his salary increases on average 2%, 3%, 4%, 5%, 6% or 7% each year until he is 65 and if the market returns 4%, 6%, 8%, 10%, 12% and an outrageous 15%. That is, he wants an output of his final retirement like this: (The first row represents % increase in his earnings, and the first column represents the various market return scenarios.). The cell in gray (denoted "First Cell" below) represents the model that you will build in Step 1 - earnings grow at 3% and the market returns 8%. Increase in earnings Aver First Cell 2% 3% 4% 5% 6% 7% 8% 4% age Mar ket Retu rn 5 6% E 8% 10% 12% 15% D G - 1 Retirement Savings 2 3 Assumptions 4 5 Current Earings Earnings hereas Stock MKT return $175,000 3% 8% Vr. Clark's Contribution To 401(k) Employer Contribution to 401(k) Additional savings hcrease in add. Savings 6% 5% $10.000 4% 10 401) Plan Pre Moui Year's Balance 11 Personal Account P. Acc. Stock Pre Wout Yar Addional Market Balance Saving amingo 410) Stock Market Earnings Mr. Carlo Contribution Employer Contributon salar 401K Plan Total Yearly total Acct Total 12 13 14 Mr. Cari Age 40 41 42 43 15 10 44 45 11 45 10 47 48 20 21 23 49 50 51 52 25 26 22 53 54 55 56 57 20 30 31 58 33 34 35 59 60 61 62 63 64 65 Sb 3 38 30 Sensitivity Analysis 40 41 42 2% Increase in earning 3% 4% 5% 6% 731 8% 4% 43 8% 44 Average Market Return 45 8% 10% 12% 15% 47Step by Step Solution
There are 3 Steps involved in it
Step: 1

Get Instant Access to Expert-Tailored Solutions
See step-by-step solutions with expert insights and AI powered tools for academic success
Step: 2

Step: 3

Ace Your Homework with AI
Get the answers you need in no time with our AI-driven, step-by-step assistance
Get Started


