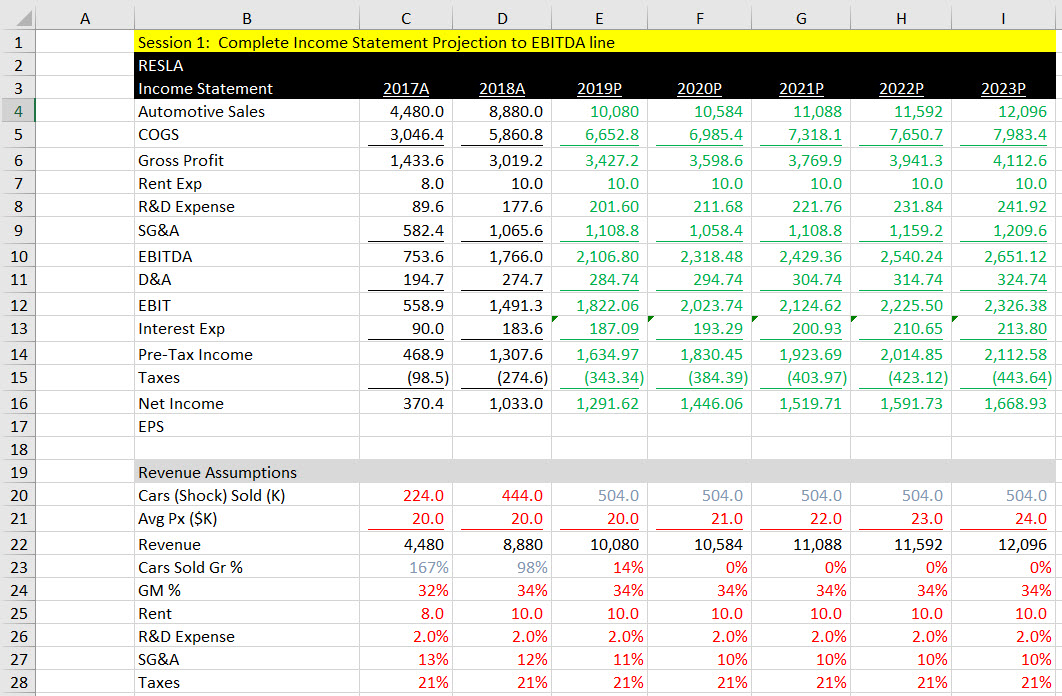
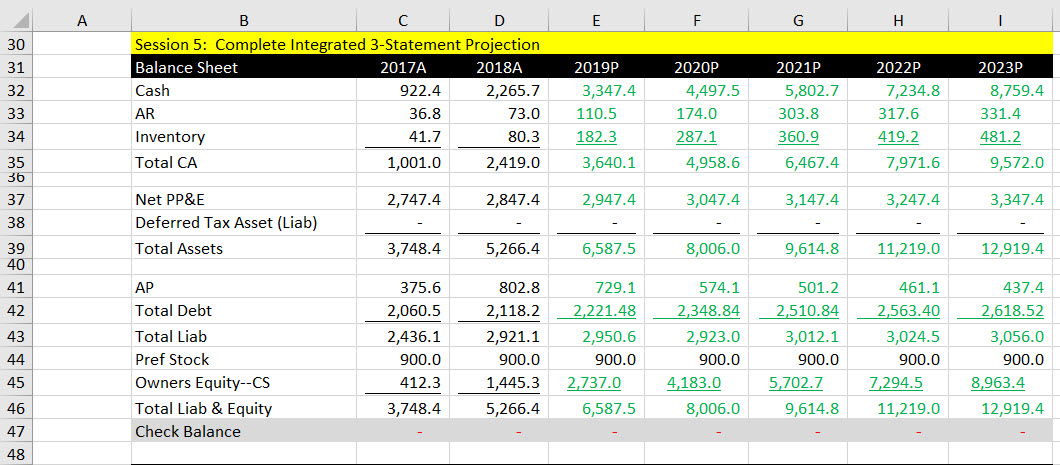
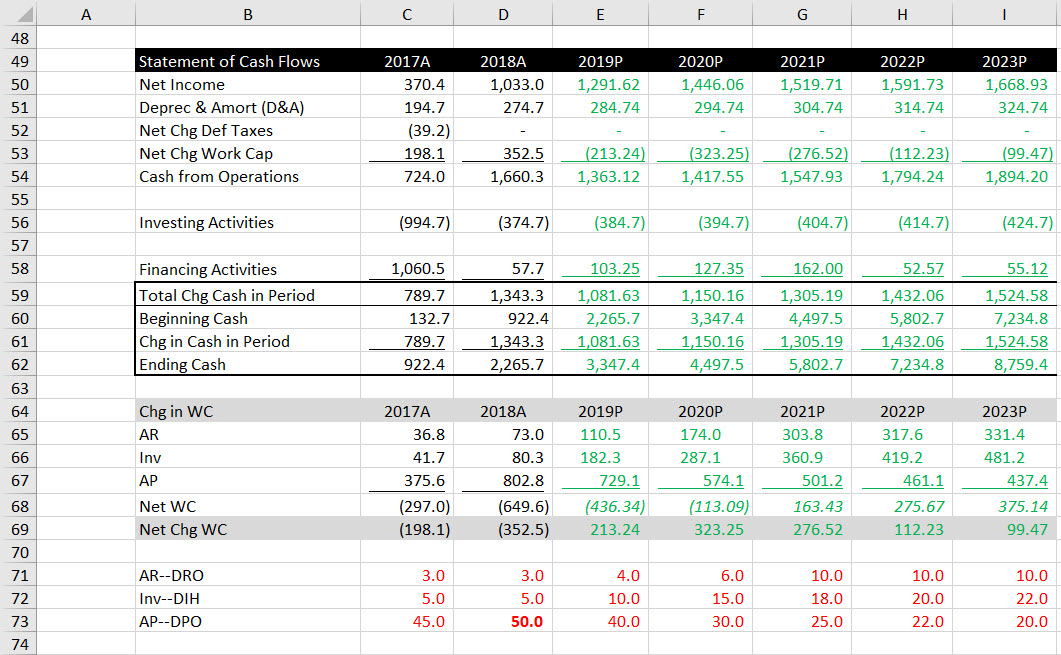
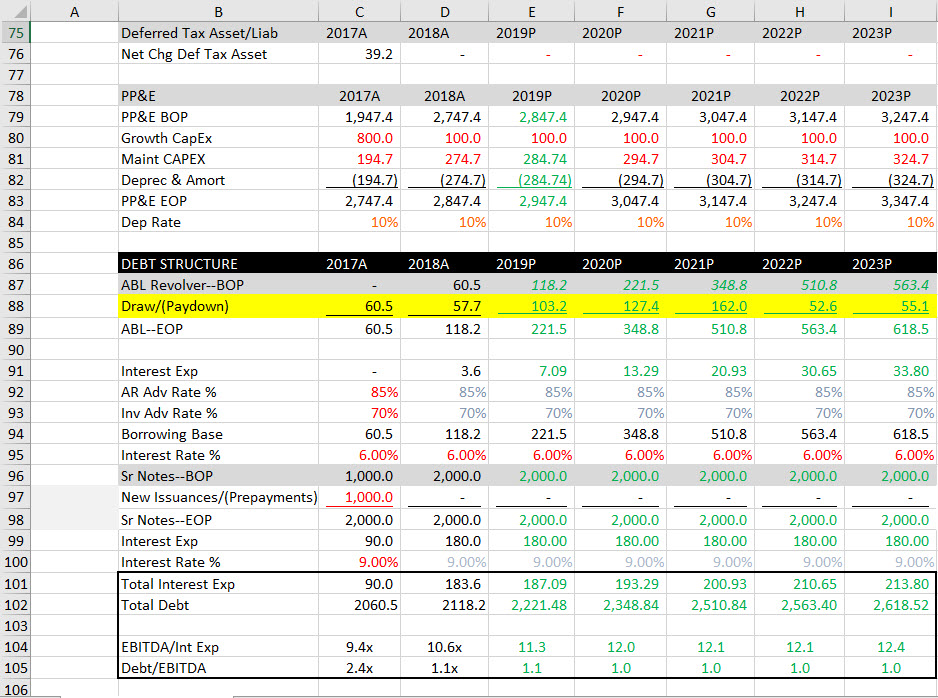
I am struggling with correctly building an Unlevered Free Cashflow Forecast and Valuationas well as DCF Valuation and valuation summary. I have an income statement, statement of cash flows, and balance sheet as a reference.
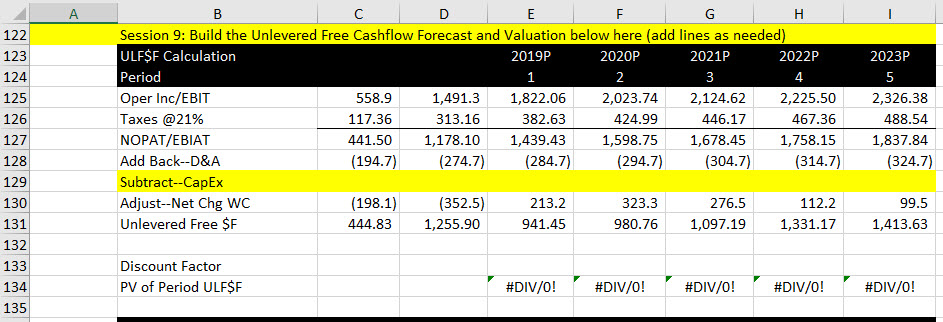
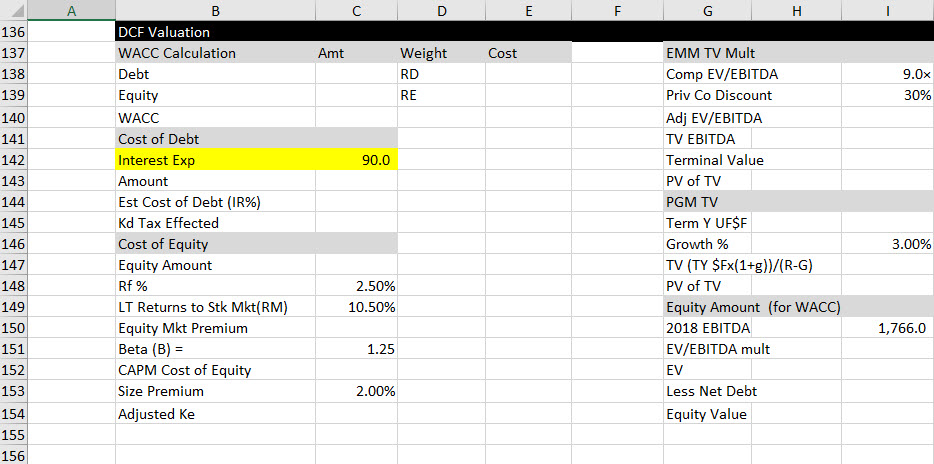
I am trying to figure out line items 122-167. I am unsure of the CapEx Value for the unlevered free cash flow calculation and interest expense for the DCF valuation cost of debt.
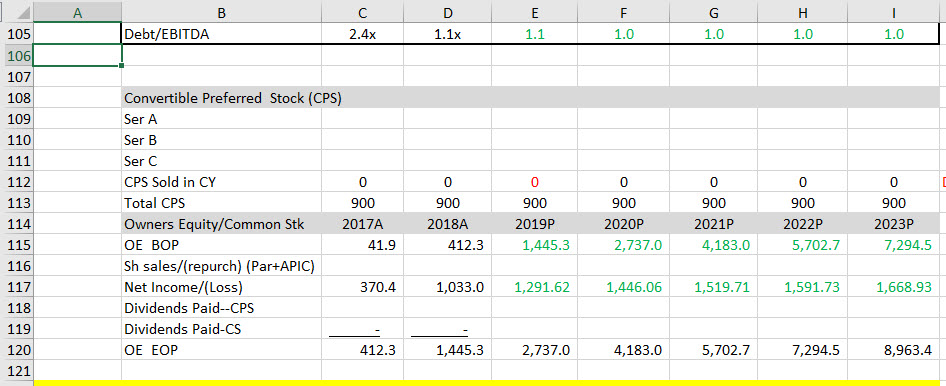
A B C D E F G H Session 1: Complete Income Statement Projection to EBITDA line W N K RESLA Income Statement 2017A 2018A 2019P 2020P 2021P 2022P 2023P Automotive Sales 4,480.0 8,880.0 10,080 10,584 11,088 11,592 12,096 COGS 3,046.4 5,860.8 6,652.8 6,985.4 7,318.1 7,650.7 7,983.4 Gross Profit 1,433.6 3,019.2 3,427.2 3,598.6 3,769.9 3,941.3 4,112.6 Rent Exp 8.0 10.0 10.0 10.0 10.0 10.0 10.0 8 R&D Expense 89.6 177.6 201.60 211.68 221.76 231.84 241.92 9 SG&A 582.4 1,065.6 1,108.8 1,058.4 1,108.8 1,159.2 1,209.6 10 EBITDA 753.6 1,766.0 2,106.80 2,318.48 2,429.36 2,540.24 2,651.12 11 D&A 194.7 274.7 284.74 294.74 304.74 314.74 324.74 12 EBIT 558.9 1,491.3 1,822.06 2,023.74 2,124.62 2,225.50 2,326.38 13 Interest Exp 90.0 183.6 187.09 193.29 200.93 210.65 213.80 14 Pre-Tax Income 468.9 1,307.6 1,634.97 1,830.45 1,923.69 2,014.85 2,112.58 15 Taxes (98.5) (274.6) (343.34) (384.39) (403.97) (423.12) (443.64) 16 Net Income 370.4 1,033.0 1,291.62 1,446.06 1,519.71 1,591.73 1,668.93 17 EPS 18 19 Revenue Assumptions 20 Cars (Shock) Sold (K) 224.0 444.0 504.0 504.0 504.0 504.0 504.0 21 Avg Px ($K) 20.0 20.0 20.0 21.0 22.0 23.0 24.0 22 Revenue 4,480 8,880 10,080 10,584 11,088 11,592 12,096 23 Cars Sold Gr % 167% 98% 14% 0% 0% 0% 0% 24 GM % 32% 34% 34% 34% 34% 34% 34% 25 Rent 8.0 10.0 10.0 10.0 10.0 10.0 10.0 26 R&D Expense 2.0% 2.0% 2.0% 2.0% 2.0% 2.0% 2.0% 27 SG&A 13% 12% 11% 10% 10% 10% 10% 28 Taxes 21% 21% 21% 21% 21% 21% 21%A B C D E F G H 30 Session 5: Complete Integrated 3-Statement Projection 31 Balance Sheet 2017A 2018A 2019P 2020P 2021P 2022P 2023P 32 Cash 922.4 2,265.7 3,347.4 4,497.5 5,802.7 7,234.8 8,759.4 33 AR 36.8 73.0 110.5 174.0 303.8 317.6 331.4 34 Inventory 41.7 80.3 182.3 287.1 360.9 419.2 481.2 35 Total CA 1,001.0 2,419.0 3,640.1 4,958.6 6,467.4 7,971.6 9,572.0 36 37 Net PP&E 2,747.4 2,847.4 2,947.4 3,047.4 3,147.4 3,247.4 3,347.4 38 Deferred Tax Asset (Liab) 39 Total Assets 3,748.4 5,266.4 6,587.5 8,006.0 9,614.8 11,219.0 40 12,919.4 41 AP 375.6 802.8 729.1 574.1 501.2 461.1 437.4 42 Total Debt 2,060.5 2,118.2 2,221.48 2,348.84 2,510.84 2,563.40 2,618.52 43 Total Liab 2,436.1 2,921.1 2,950.6 2,923.0 3,012.1 3,024.5 3,056.0 44 Pref Stock 900.0 900.0 900.0 900.0 900.0 900.0 900.0 45 Owners Equity--CS 412.3 1,445.3 2,737.0 4,183.0 5,702.7 7,294.5 8,963.4 46 Total Liab & Equity 3,748.4 5,266.4 6,587.5 8,006.0 9,614.8 11,219.0 12,919.4 47 Check Balance 48A B C D E F G H 48 49 Statement of Cash Flows 2017A 2018A 2019P 2020P 2021P 2022P 2023P 50 Net Income 370.4 1,033.0 1,291.62 1,446.06 1,519.71 1,591.73 1,668.93 51 Deprec & Amort (D&A) 194.7 274.7 284.74 294.74 304.74 314.74 324.74 52 Net Chg Def Taxes (39.2) 53 Net Chg Work Cap 198.1 352.5 (213.24) (323.25) (276.52) (112.23) (99.47) 54 Cash from Operations 724.0 1,660.3 1,363.12 1,417.55 1,547.93 1,794.24 1,894.20 55 56 Investing Activities (994.7) (374.7) (384.7) (394.7) (404.7) (414.7) (424.7) 57 58 Financing Activities 1,060.5 57.7 103.25 127.35 162.00 52.57 55.12 59 Total Chg Cash in Period 789.7 1,343.3 1,081.63 1,150.16 1,305.19 1,432.06 1,524.58 60 Beginning Cash 132.7 922.4 2,265.7 3,347.4 4,497.5 5,802.7 7,234.8 61 Chg in Cash in Period 789.7 1,343.3 1,081.63 1,150.16 1,305.19 1,432.06 1,524.58 62 Ending Cash 922.4 2,265.7 3,347.4 4,497.5 5,802.7 7,234.8 8,759.4 63 64 Chg in WC 2017A 2018A 2019P 2020P 2021P 2022P 2023P 65 AR 36.8 73.0 110.5 174.0 303.8 317.6 331.4 66 Inv 41.7 80.3 182.3 287.1 360.9 419.2 481.2 67 AP 375.6 802.8 729.1 574.1 501.2 461.1 437.4 68 Net WC (297.0) (649.6) (436.34) (113.09) 163.43 275.67 375.14 69 Net Chg WC (198.1) (352.5) 213.24 323.25 276.52 112.23 99.47 70 71 AR--DRO 3.0 3.0 4.0 6.0 10.0 10.0 10.0 72 Inv--DIH 5.0 5.0 10.0 15.0 18.0 20.0 22.0 73 AP--DPO 45.0 50.0 40.0 30.0 25.0 22.0 20.0 74A B C D E F G H 75 Deferred Tax Asset/Liab 2017A 2018A 2019P 2020P 2021P 2022P 2023P 76 Net Chg Def Tax Asset 39.2 77 78 PP&E 2017A 2018A 2019P 2020P 2021P 2022P 2023P 79 PP&E BOP 1,947.4 2,747.4 2,847.4 2,947.4 3,047.4 3,147.4 3,247.4 80 Growth CapEx 800.0 100.0 100.0 100.0 100.0 100.0 100.0 81 Maint CAPEX 194.7 274.7 284.74 294.7 304.7 314.7 324.7 82 Deprec & Amort (194.7) (274.7) (284.74) (294.7) (304.7) (314.7) (324.7) 83 PP&E EOP 2,747.4 2,847.4 2,947.4 3,047.4 3,147.4 3,247.4 3,347.4 84 Dep Rate 10% 10% 10% 10% 10% 10% 10% 85 86 DEBT STRUCTURE 2017A 2018A 2019P 2020P 2021P 2022P 2023P 87 ABL Revolver--BOP 60.5 118.2 221.5 348.8 510.8 563.4 88 Draw/(Paydown) 60.5 57.7 103.2 127.4 162.0 52.6 55.1 89 ABL--EOP 60.5 118.2 221.5 348.8 510.8 563.4 618.5 90 91 Interest Exp 3.6 7.09 13.29 20.93 30.65 33.80 92 AR Adv Rate % 85% 85% 85% 85% 85% 85% 85% 93 Inv Adv Rate % 70% 70% 70% 70% 70% 70% 70% 94 Borrowing Base 60.5 118.2 221.5 348.8 510.8 563.4 618.5 95 Interest Rate % 6.00% 6.00% 6.00% 6.00% 6.00% 6.00% 6.00% 96 Sr Notes--BOP 1,000.0 2,000.0 2,000.0 2,000.0 2,000.0 2,000.0 2,000.0 97 New Issuances/(Prepayments) 1,000.0 98 Sr Notes--EOP 2,000.0 2,000.0 2,000.0 2,000.0 2,000.0 2,000.0 2,000.0 99 Interest Exp 90.0 180.0 180.00 180.00 180.00 180.00 180.00 100 Interest Rate % 9.00% 9.00% 9.00% 9.00% 9.00% 9.00% 9.00% 101 Total Interest Exp 90.0 183.6 187.09 193.29 200.93 210.65 213.80 102 Total Debt 2060.5 2118.2 2,221.48 2,348.84 2,510.84 2,563.40 2,618.52 103 104 EBITDA/Int Exp 9.4x 10.6x 11.3 12.0 12.1 12.1 12.4 105 Debt/EBITDA 2.4x 1.1x 1.1 1.0 1.0 1.0 1.0 106\fA B C D E F G H 122 Session 9: Build the Unlevered Free Cashflow Forecast and Valuation below here (add lines as needed) 123 ULF$F Calculation 2019P 2020P 2021P 2022P 2023P 124 Period 1 2 3 4 5 125 Oper Inc/EBIT 558.9 1,491.3 1,822.06 2,023.74 2,124.62 2,225.50 2,326.38 126 Taxes @21% 117.36 313.16 382.63 424.99 446.17 467.36 488.54 127 NOPAT/EBIAT 441.50 1,178.10 1,439.43 1,598.75 1,678.45 1,758.15 1,837.84 128 Add Back--D&A (194.7) (274.7) (284.7) (294.7) (304.7) (314.7) (324.7) 129 Subtract--CapEx 130 Adjust--Net Chg WC (198.1) (352.5) 213.2 323.3 276.5 112.2 99.5 131 Unlevered Free $F 444.83 1,255.90 941.45 980.76 1,097.19 1,331.17 1,413.63 132 133 Discount Factor 134 PV of Period ULF$F #DIV/O! #DIV/O! #DIV/O! #DIV/O! #DIV/O! 135A B C D E F G H 157 Valuation Summary 158 DCF Valuation EMM PGM Comp Valuation EV/EBITDA EV/Rev* EV/EBITDA* 159 PV Projection $F Target/Resla 160 PV-TV Multiple--Adj 6.3x 0.0x 0.0x 161 Enterprise Value Implied EV 162 Less: Net Debt Less: Net Debt 163 Equity Value Equity Value 164 Per Share Value Per Share Value 165 P/E Ratio--2018 166 P/E Ratio--2019 167 FD Shares 162.8 162.8 162.8 162.8 162.8 168A B C D E F G H 136 DCF Valuation 137 WACC Calculation Amt Weight Cost EMM TV Mult 138 Debt RD Comp EV/EBITDA 9.0x 139 Equity RE Priv Co Discount 30% 140 WACC Adj EV/EBITDA 141 Cost of Debt TV EBITDA 142 Interest Exp 90.0 Terminal Value 143 Amount PV of TV 144 Est Cost of Debt (IR%) PGM TV 145 Kd Tax Effected Term Y UFSF 146 Cost of Equity Growth % 3.00% 147 Equity Amount TV (TY $Fx(1+g))/(R-G) 148 Rf % 2.50% PV of TV 149 LT Returns to Stk Mkt(RM) 10.50% Equity Amount (for WACC) 150 Equity Mkt Premium 2018 EBITDA 1,766.0 151 Beta (B) = 1.25 EV/EBITDA mult 152 CAPM Cost of Equity EV 153 Size Premium 2.00% Less Net Debt 154 Adjusted Ke Equity Value 155 156
