Question
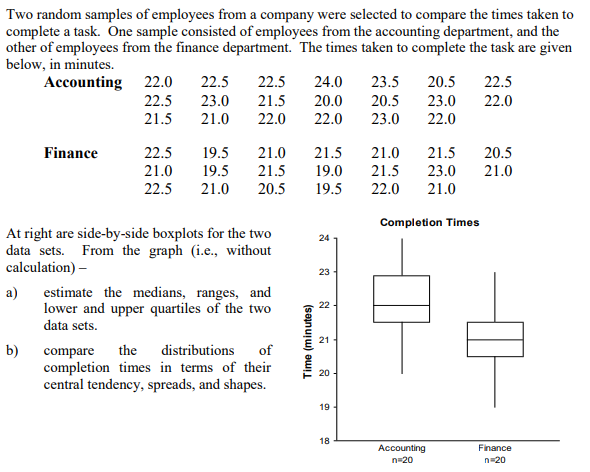
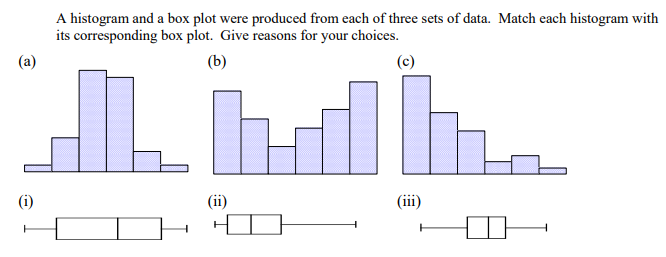
I am stuck here can anyone help me with these questions below 1.A manufacturing company produces steel housings for electrical equipment. The main component part
I am stuck here can anyone help me with these questions below
1.A manufacturing company produces steel housings for electrical equipment. The main component part of the housing is a steel trough that is made of a 14-gauge steel coil. It is produced using a 250-ton progressive punch press with a wipe down operation and two- 90 degree forms placed in the flat steel to make the trough. The distance from one side of the form to the other is critical because of weatherproofing in outdoor applications. The company requires that the width if the trough6 be between 8.31 inches and 8.61 inches. Data are collected from a sample of 49 troughs and are as given below. The data gives the width of the troughs in inches.
8.312, 8.343, 8.317, 8.383, 8.348, 8.410, 8.351, 8.373, 8.481, 8.422, 8.476, 8.382, 8.484, 8.403, 8.414, 8.419, 8.385, 8.465, 8.498, 8.447, 8.436, 8.413, 8.489, 8.414, 8.481, 8.415, 8.479, 8.429, 8.458, 8.462, 8.460, 8.444, 8.429, 8.460, 8.412, 8.420, 8.410, 8.405, 8.323, 8.420, 8.396, 8.447, 8.405, 8.439, 8.411, 8.427, 8.420, 8.498, 8.409.
a) Use Excel to generate the table of descriptive statistics. Interpret the measures of central tendency and variability.
b) List the five-number summary
c) Construct a boxplot and describe its shape; and
d) What can you conclude about the number of troughs that will meet the company's requirement of troughs being between 8.31 and 8.61 inches wide?
2.A bank branch located in a commercial district of a city has the business objective of developing an improved process for serving customers during the noon-to-1:00 P.M. lunch period. The waiting time, in minutes, is defined as the time the customer enters the line to when he or she reaches the teller window. Data are collected from a sample of 15 customers during this hour. The waiting times in minutes are given below: 4.21, 5.55, 3.02, 5.13, 4.77, 2.34, 3.54, 3.20, 4.50, 6.10, 0.38, 5.12, 6.46, 6.19, 3.79 Another bank branch, located in a residential area, is also concerned with the noon-to-1 P.M. lunch hour. The waiting times, in minutes, collected from a sample of 15 customers during this hour, are given below: 9.66, 5.90, 8.02, 5.79, 8.73, 3.82, 8.01, 8.35, 10.49, 6.68, 5.64, 4.08, 6.17, 9.91, 5.47.
a) List the five-number summaries of the waiting times at the two banks.
b) Construct boxplots and describe the shapes of the distributions for the two bank branches.
c) What similarities and differences are there in the distributions of the waiting times at the two bank branches?
3.We are estimating the mean sales of two new hair care products after 4 weeks of the release (simultaneously) date to the market. Suppose that the standard deviation of sales for the first product is 5 and that for the second product is 10, and we randomly sample 20 stores selling both products.
(a) If we use the sample mean to estimate the population mean in each case, for which product would you expect our estimate be more "accurate"? Why?
(b) The first product sample mean was 19.8 and the second product sample mean was 42.6. Comment on the "accuracy" of these estimates for the two population mean sales. (HINT: Calculate the coefficients of variation i.e. CVs.)
(c) Discuss any shortcomings in the study and suggest ways to improve the study in order to get more accurate results.
4.The file HotelAway contains the average room price (in US$) paid by various nationalities while travelling abroad in 2013: 179, 173, 175, 173, 164, 143, 153, 155.
a) Compute the mean, median, and mode.
b) Compute the range, variance and standard deviation.
c) Based on the results of (a) and (b), what conclusions can you reach concerning the room price (in US$) in 2013?
5.


Step by Step Solution
There are 3 Steps involved in it
Step: 1

Get Instant Access to Expert-Tailored Solutions
See step-by-step solutions with expert insights and AI powered tools for academic success
Step: 2

Step: 3

Ace Your Homework with AI
Get the answers you need in no time with our AI-driven, step-by-step assistance
Get Started


