Answered step by step
Verified Expert Solution
Link Copied!

Question

1 Approved Answer

I am stuck on the attached question how can i figure this out. (I don't need help with the comparison in part c.) The score

I am stuck on the attached question how can i figure this out. (I don't need help with the comparison in part c.)

The score data is:

35

55

60

69

44

55

60

70

46

57

60

72

47

57

60

73

47

57

60

73

48

58

62

75

49

59

62

75

51

59

62

77

53

59

64

82

54

59

68

88

The original mean I calculated is 60.525, and the SD is 10.96. I just don't know where to go from there.
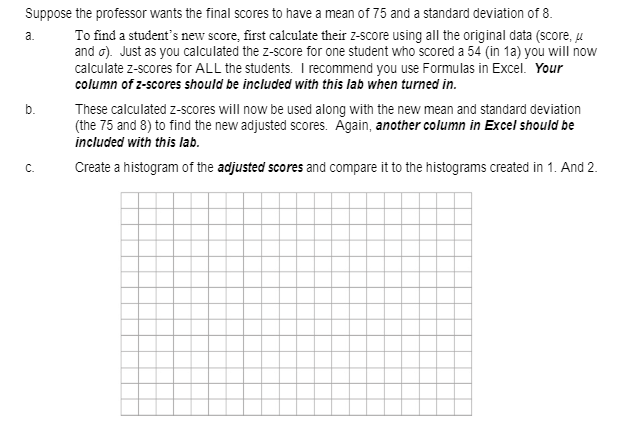
image text in transcribed
Suppose the professor wants the final scores to have a mean of 75 and a standard deviation of 8. a To find a student's new score, first calculate their Z-score using all the original data (score, A and o). Just as you calculated the z-score for one student who scored a 54 (in 1a) you will now calculate z-scores for ALL the students. I recommend you use Formulas in Excel. Your column of z-scores should be included with this lab when turned in. b. These calculated z-scores will now be used along with the new mean and standard deviation (the 75 and 8) to find the new adjusted scores. Again, another column in Excel should be included with this lab. C. Create a histogram of the adjusted scores and compare it to the histograms created in 1. And 2

Step by Step Solution

There are 3 Steps involved in it

Step: 1

blur-text-image

Get Instant Access to Expert-Tailored Solutions

See step-by-step solutions with expert insights and AI powered tools for academic success

Step: 2

blur-text-image

Step: 3

blur-text-image

Ace Your Homework with AI

Get the answers you need in no time with our AI-driven, step-by-step assistance

Get Started

Recommended Textbook for

Square Summable Power Series

Authors: Louis De Branges, James Rovnyak

1st Edition

0486801365, 9780486801360

More Books

Students also viewed these Mathematics questions